 fidopt
UCSD-BMETS-Longitudinal
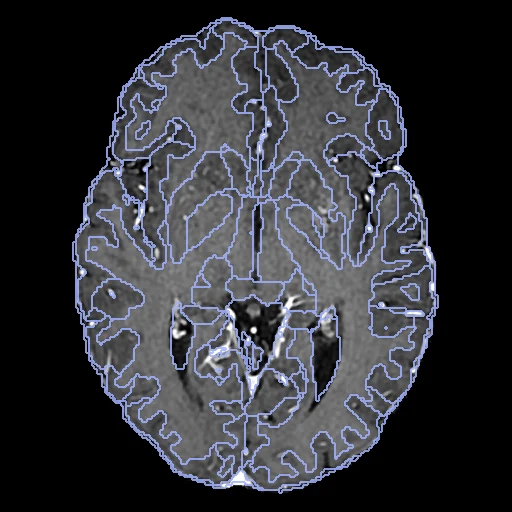
Contrast-enhanced T1 brain MR of one patient with brain metastases at the dataset's first two dates, weeks to years apart, skull-stripped and registered affinely to the first by the provider (UCSD-BMETS-Longitudinal).
Read before comparing (9)
- Labels. SynthSeg-robust 2.0, a network, segments each T1c, so the dataset is ranked apart with the others whose truth comes from a network. SynthMorph was trained on label maps made by SynthSeg to overlap 21 of these structures: it is scored against labels of the kind it learned from and may be favoured.
- Label noise. SynthSeg runs at 1 mm and its labels come back by nearest neighbour onto the image's 0.5 to 1.2 mm grid. Two resamplings of BMETS0049's first T1c a fraction of a voxel apart give labels that agree at a mean Dice of 0.86. 176 of the 300 patients change scanner model or field strength between the dates, so no registration reaches a Dice of 1.
- Lesions. The dataset's segmentation of each date in the BraTS compartments, an nnU-Net proposal corrected by hand and approved by a board-certified neuroradiologist, is shown (dice_lesion), never ranked: its overlap measures the response to treatment and rewards a field that grows or shrinks a lesion. The labels are 0 inside each date's segmentation.
- Treatment. On the test pairs the segmented volume changes between the dates (BMETS0048: 200 ml to 15 ml), and lesions appear (BMETS0162, BMETS0199) or vanish (BMETS0042); those three give no lesion Dice. On the 27 others it is 0.26 as delivered (0.00 to 0.72).
- Alignment. The provider skull-stripped every series (HD-BET) and registered it affinely (CapTK/Greedy) onto the first date's T1c grid; the pair is used as delivered, the moving image interpolated once. What is left is the change of the brain between the dates, around the lesions and elsewhere, plus what the affine left.
- Baseline. As delivered the labels of the test pairs overlap at a mean Dice of 0.79 (0.56 to 0.89), HD95 2.4 mm (0.92 to 8.8): the board measures mostly the last millimetres, except where the brain moved around a lesion (BMETS0048, 0.66 and 8.8 mm).
- Dates. A patient has two to four dates; the pair is the first two, a median of 0.1 year apart, up to 3.4. For 17 patients the first date is an MRI from before the metastases were diagnosed.
- Images. Skull-stripped, so no mask is given; the intensities are the scanner's, as delivered.
- No method here does better than no registration on Dice (0.791): as far as these annotations can tell, the pairs already match.
| Accuracy | Smoothness | Cost | ||||||||
|---|---|---|---|---|---|---|---|---|---|---|
| # | Method | Dice | Change | HD95 mm | SDlogJ | Folds % | Time s | RAM GB | GPU GB | Images |
| 1 | NiftyRegCPUapp | 0.768 ±0.036 | −0.023 | 2.79 ±0.73 | 0.038 | 0.10 | 270 | 5.6 | ||
| 2 | DemonsCPUapp | 0.690 ±0.046 | −0.101 | 3.48 ±0.78 | 0.022 | 0.00 | 61 | 8.2 | ||
| No registration | 0.791 ±0.030 | 2.45 ±0.69 | 0.000 | 0.00 | ||||||
The order averages each method's ranks on Dice, HD95 mm, SDlogJ, so the first one is not always the best in every column. ± is the 95% interval of the mean over the 30 pairs. Two neighbours are tied when a paired Wilcoxon test on the shared pairs does not find the upper one better on Dice (5%): the places a method could hold are then shown under its own. The best value of each column is in colour. Click a row to see its images, a column title to sort by it. Time and memory measured on Laptop.
1 result not ranked: an older run, pairs still missing, or a failure on every pair
| Accuracy | Smoothness | Cost | |||||||||
|---|---|---|---|---|---|---|---|---|---|---|---|
| # | Method | Dice | Change | HD95 mm | SDlogJ | Folds % | Time s | RAM GB | GPU GB | Machine | Images |
| ConvexAdam (MIND)GPUapp21/30 pairs | 0.792 ±0.069 | +0.001 | 3.09 ±2.00 | 0.020 | 0.08 | 26 | 4.7 | 11.8 | Laptop | ||
Dice: how much the organ contours overlap, 1 is perfect. HD95: distance between the contours' surfaces. SDlogJ: how irregular the deformation is, 0 is perfectly smooth. Folds: share of the image where the deformation folds over itself.
Pair by pair
Click a score to look at that result: the fixed image, and over it the moving image after registration, with the annotations. Underlined scores have their image; for the others you see the pair without the result. A green cell gained against no registration on that pair, a red one lost.
About the data
- Test pairs
- 30 test patients drawn with seed 2026 among the 300, then 27 development patients among the 270 left, one case a patient.
- Truth
- contours by a program lesion by experts SynthSeg's segmentation run by us on each T1c (SynthSeg-robust 2.0 with the cortical parcellation, FreeSurfer 7.4.1): 30 structures (white matter, ventricles, deep grey nuclei, hippocampus, amygdala, cerebellum, brainstem, CSF) and 68 Desikan-Killiany cortical regions, outside the tumour, oedema and resection cavity the dataset segments at that date
- Licence
- CC BY 4.0
27 pairs for tuning, never tested
BMETS0001, BMETS0002, BMETS0003, BMETS0181, BMETS0299, BMETS0175, BMETS0268, BMETS0094, BMETS0132, BMETS0058, BMETS0145, BMETS0281, BMETS0241, BMETS0230, BMETS0004, BMETS0059, BMETS0234, BMETS0139, BMETS0038, BMETS0160, BMETS0006, BMETS0069, BMETS0259, BMETS0055, BMETS0092, BMETS0043, BMETS0209