 fidopt
SPIDER
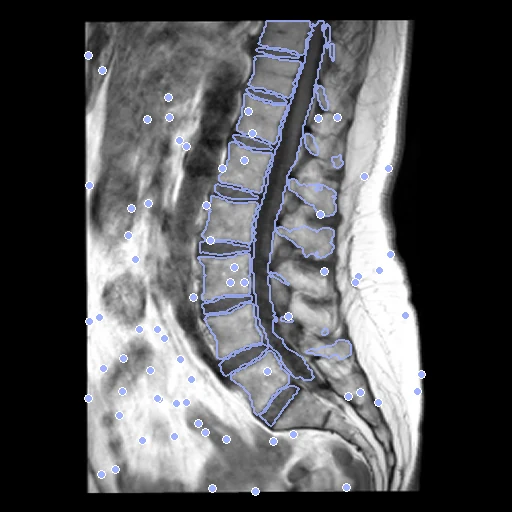
Sagittal T1 (fixed) and T2 (moving) MR of the lumbar spine from one study of a patient with low back pain, the T2 deformed by a known smooth transform (SPIDER).
Read before comparing (6)
- Truth. Synthetic, ranked apart: a seeded cubic B-spline, knots every 40 mm and coefficients within 15 mm, deforms the T2 and its labels and pairs 300 foreground landmarks, exact by construction. It measures no patient motion; the residual mismatch between the two acquired contrasts stays in the task.
- Labels. The provider labels vertebrae, discs and spinal canal on both contrasts: a network's proposal, corrected slice by slice by annotators under clinical supervision. Several maps were propagated from one contrast to the other, so a pair's two maps are not two independent delineations.
- Numbering. Labels denote position, not anatomical name: 1 is the lowest lumbar vertebra present, numbers rise cranially, 100 is the spinal canal, and 201 onward are the discs from caudal to cranial. The sacrum is unlabelled.
- Alignment. Some provider frames put the T1 and T2 origins hundreds of millimetres apart within one study. The moving image's and truth headers carry a translation from intensities and body masks only, resampling no grid. Study 35's start is zero, its source headers already aligning it: the intensity translation put its T2 about 147 mm too high, and the zero start lifts its Dice from effectively zero to 0.526.
- Fields of view. The two contrasts can differ in field of view and slice thickness: a structure absent from one image cannot be recovered, and the 3D warp may move anatomy across thick sagittal slices. Study 35's T2 holds three lower vertebrae against eight on its T1, leaving an HD95 of 34.93 mm.
- Baseline. With no registration the 19 test studies score a median Dice of 0.582, an HD95 of 4.72 mm and a landmark TRE of 4.56 mm.
| Accuracy | Smoothness | Cost | ||||||||||
|---|---|---|---|---|---|---|---|---|---|---|---|---|
| # | Method | Dice | Change | HD95 mm | TRE mm | rTRE | SDlogJ | Folds % | Time s | RAM GB | GPU GB | Images |
| 1 | NiftyRegCPUapp | 0.829 ±0.040 | +0.244 | 4.42 ±3.26 | 2.67 ±0.65 | 0.0064 ±0.0015 | 0.441 | 1.31 | 35 | 0.6 | ||
| 2 | ConvexAdam (MIND)GPUapp6 failed | 0.748 ±0.058 | +0.163 | 5.19 ±3.50 | 3.44 ±0.44 | 0.0083 ±0.0011 | 0.036 | 0.02 | 5 | 2.4 | 1.9 | |
| No registration | 0.585 ±0.032 | 6.25 ±3.36 | 4.55 ±0.16 | 0.0110 ±0.0005 | 0.000 | 0.00 | ||||||
The order averages each method's ranks on Dice, HD95 mm, TRE mm, SDlogJ, so the first one is not always the best in every column. ± is the 95% interval of the mean over the 19 pairs. Two neighbours are tied when a paired Wilcoxon test on the shared pairs does not find the upper one better on Dice (5%): the places a method could hold are then shown under its own. The best value of each column is in colour. Click a row to see its images, a column title to sort by it. Time and memory measured on Laptop.
Dice: how much the organ contours overlap, 1 is perfect. HD95: distance between the contours' surfaces. TRE: distance between matching landmarks. rTRE: the TRE over the length of the image's diagonal, to compare datasets of other sizes and units. SDlogJ: how irregular the deformation is, 0 is perfectly smooth. Folds: share of the image where the deformation folds over itself.
Pair by pair
Click a score to look at that result: the fixed image, and over it the moving image after registration, with the annotations. Underlined scores have their image; for the others you see the pair without the result. A green cell gained against no registration on that pair, a red one lost.
About the data
- Test pairs
- 19 test studies, 10% of 190 eligible independent subjects, then 17 development studies, 10% of the 171 left, in a draw with seed 2026 stratified by hospital. One study per subject, so no subject is in both sets. The hidden challenge test studies are not included.
- Truth
- contours a known deformation landmarks a known deformation each vertebra, intervertebral disc and the spinal canal, one label each, on each series (a network's proposal corrected slice by slice by the dataset's annotators), then carried through the known deformation 300 points drawn in the T1's foreground, paired through the known deformation
- Licence
- CC BY 4.0
17 pairs for tuning, never tested
168, 58, 166, 30, 64, 252, 185, 223, 3, 167, 222, 115, 239, 207, 47, 60, 161