 fidopt
UCSD-PTGBM, glioblastoma after treatment
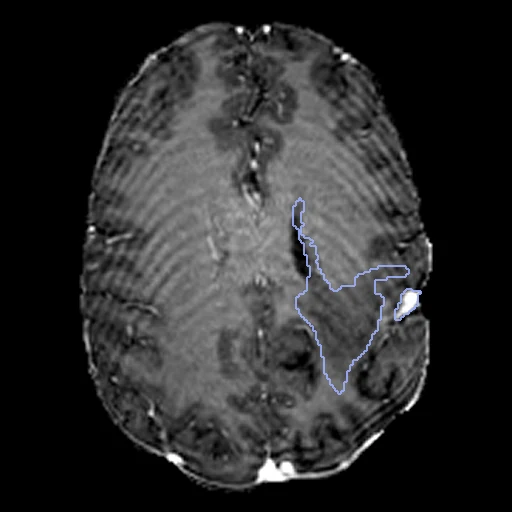
Brain MR of a patient treated for a high-grade glioma at UC San Diego, four sequences as one image on a 1 mm MNI grid, the four compartments of BraTS 2024 labelled (UCSD-PTGBM, TCIA).
Read before comparing (11)
- Cohort. 178 patients with a histopathologically proven high-grade glioma treated at UC San Diego from 2010 to 2022: 243 post-treatment timepoints, 235 of them glioblastomas, all on 3 T GE scanners at two UCSD-affiliated institutions. One hospital: no strata in the draw.
- Test data. BraTS-GLI 2024 Test Data, 42 subjects, was BraTS 2024's hidden test set, so a network trained on its released data has not seen it; its labels have been public on TCIA since January 2026. A subject is in one split only.
- Image. T1pre, T1post, T2 and FLAIR as one image of four components a voxel, as on BraTS2021: the sequences the annotators read. Only a method that takes those four channels runs on it. The provider's 32-bit floats, untouched.
- Grid. The provider registered each series to a 1 mm MNI atlas grid and skull-stripped it with a brain mask from the FLAIR, a neuroradiology fellow checking every registration. The images are zero outside the brain; no mask is given. The T2, acquired in 3 mm slices, stays blurred head to foot on 14 of the 20 cases built first.
- Truth. OnQ Neuro (Cortechs.ai), a deep-learning product, segmented each timepoint; trained radiologists corrected every map, and a board-certified neuroradiologist sent an inaccurate one back until it was accurate. One final map a timepoint, no measure of agreement.
- Labels. Read from the images on the first 20 cases, the data descriptor giving no numbers: 1 the non-enhancing or necrotic core, 2 the FLAIR hyperintensity, 3 the enhancing tumour, 4 the resection cavity, BraTS 2024's numbering. Each is scored on its own; BraTS 2024 also scores lesion by lesion, the tumour core and the whole tumour, so its numbers do not compare.
- Presence. All forty test cases hold the enhancing tumour and the FLAIR hyperintensity, 25 the non-enhancing core and 31 the cavity.
- Checks. Every case holds only 0 to 4 on its image's grid, and where looked at the labels lie on their lesion. Skull stripping cut into some lesions, leaving label voxels where the channels are zero (30 of UCSD-PTGBM-0048_01's cavity) that no method can see.
- Held out. UCSD-PTGBM-0017, 0018, 0037, 0039, 0047, 0053, 0038 and 0041, whose first T2 covers only 1 to 39% of what the post-contrast T1 covers. 0017_01 had been drawn for development; the next of the seeded order, 0110_01, replaced it.
- Room. Small labels weigh on the Dice: moved by one voxel, the first ten test maps keep a mean Dice of 0.85 for the enhancing tumour, 0.78 for the core, 0.87 for the FLAIR hyperintensity and 0.90 for the cavity. The surface Dice, at 1 mm as the provider sets no tolerance, forgives such a move.
- Overlap. Not UCSDBrainMets's patients: UCSD-BMETS-Longitudinal holds metastases of cancers from elsewhere, this collection primary high-grade gliomas, and the two diagnoses exclude each other; no other descriptor names this collection. A registration dataset built later from it should keep these 40 test subjects among its test cases and these 13 development subjects out of them.
| Accuracy | Cost | |||||||
|---|---|---|---|---|---|---|---|---|
| # | Method | Dice | Surface Dice | HD95 mm | Time s | RAM GB | GPU GB | Images |
| 1 | MONAI BraTS SegResNetGPUapp3 of 4 structures | 0.493 ±0.077 | 0.521 ±0.075 | 23.69 ±8.72 | 18 | 6.0 | 6.2 | |
The order averages each method's ranks on Dice, Surface Dice, HD95 mm, so the first one is not always the best in every column. ± is the 95% interval of the mean over the 40 cases. Two neighbours are tied when a paired Wilcoxon test on the shared cases does not find the upper one better on Dice (5%): the places a method could hold are then shown under its own. The best value of each column is in colour. Click a row to see its images, a column title to sort by it. Time and memory measured on Workstation.
1 result not ranked: an older run, cases still missing, or a failure on every case
| Accuracy | Cost | ||||||||
|---|---|---|---|---|---|---|---|---|---|
| # | Method | Dice | Surface Dice | HD95 mm | Time s | RAM GB | GPU GB | Machine | Images |
| MONAI BraTS SegResNetGPUapp3 of 4 structuresolder run | 0.493 ±0.077 | 0.521 ±0.075 | 23.69 ±8.72 | 9 | 3.7 | 4.0 | Laptop | ||
Dice: how much the organ contours overlap, 1 is perfect. Surface Dice: the share of the contours' surfaces within a tolerance of each other, 1 is perfect. HD95: distance between the contours' surfaces.
Case by case
Click a score to look at that result: the image, the truth in green and the method's map in red. Underlined scores have their image; for the others you see the case without the result.
About the data
- Test cases
- The 40 subjects of the collection's BraTS-GLI 2024 Test Data, BraTS 2024's held-out glioma test data, whose four sequences cover the brain, taken whole. 13 development subjects drawn with seed 2026 among the 130 such subjects of the main package, the last of their seeded order. Eight subjects whose first T2 covers only a slab are left out. A case is a subject's first timepoint.
- Truth
- contours by experts the dataset's BraTS-style label map, 1 the non-enhancing or necrotic tumour core, 2 the surrounding non-enhancing FLAIR hyperintensity, 3 the enhancing tumour, 4 the resection cavity (the numbers read from the images, see the notes): OnQ Neuro's automatic segmentation corrected by trained radiologists, every map reviewed by a board-certified neuroradiologist who sent an inaccurate one back to another annotator until it was accurate
- Source
- www.cancerimagingarchive.net/collection/ucsd-ptgbm
doi.org/10.7937/fwv2-dt74
doi.org/10.1038/s41597-025-06499-z
www.cancerimagingarchive.net/wp-content/uploads/UCSD_PTGBM-clinical-information_v3_2026-12-Mar.xlsx
arxiv.org/abs/2405.18368
www.cancerimagingarchive.net/collection/ucsd-bmets-longitudinal - Licence
- CC BY 4.0
13 cases for tuning, never tested
UCSD-PTGBM-0035_01, UCSD-PTGBM-0084_01, UCSD-PTGBM-0008_01, UCSD-PTGBM-0172_01, UCSD-PTGBM-0163_01, UCSD-PTGBM-0142_01, UCSD-PTGBM-0097_01, UCSD-PTGBM-0025_01, UCSD-PTGBM-0059_01, UCSD-PTGBM-0110_01, UCSD-PTGBM-0167_01, UCSD-PTGBM-0062_01, UCSD-PTGBM-0136_01