 fidopt
MU-Glioma-Post, glioma after treatment
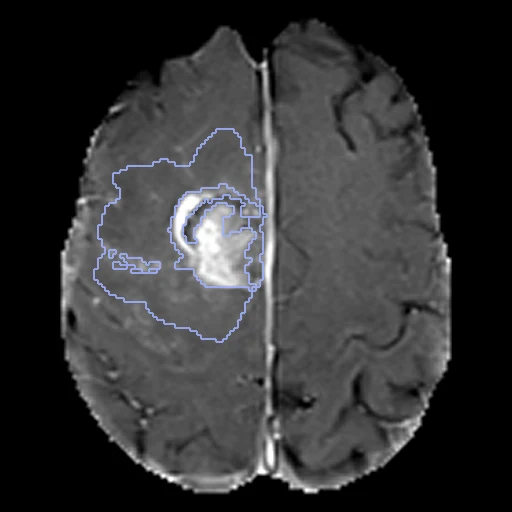
Post-treatment brain MR of a glioma patient at the University of Missouri: T1, post-contrast T1, T2 and FLAIR as one four-channel image on SRI24, skull-stripped, with BraTS 2024's four compartments labelled (MU-Glioma-Post, TCIA).
Read before comparing (10)
- Pool. 203 patients with a pathologically proven glioma, 157 of them glioblastoma, each with one to six post-treatment timepoints. The earliest with a mask is Timepoint_1 for 187 patients and a later one for 16.
- Images. The provider resampled each series to 1 mm, registered it rigidly to SRI24, corrected its bias field and skull-stripped it: 240 x 240 x 155 voxels, zero outside the brain, no mask given. Only a method that takes the four channels runs on it. Thick 2D acquisitions stay blurred head to foot, the T2 on all 20 cases built first.
- Truth. The FeTS networks' outputs fused by STAPLE, corrected by a medical student, reviewed independently by two radiology residents and a neuroradiology fellow, approved by two neuroradiologists by consensus. The networks' output matches the final labels at a mean Dice of 0.990 for the whole tumour: the boundaries are mostly the networks', and a method close to them may be favoured.
- Labels. 1 non-enhancing tumour core, 2 FLAIR hyperintensity (infiltrative tumour and oedema), 3 enhancing tissue, 4 resection cavity, as BraTS 2024 numbers them. Each label is scored on its own; a label a case lacks is not scored unless a method writes it, a false positive at 0.
- Specks. Over the 20 test cases the FLAIR hyperintensity is on 20 (9.6 to 169 ml), the enhancing tissue on 19, the cavity on 18 and the core on 13. Some labels are specks of a few voxels, such as the enhancing tissue of PatientID_0121 and 0242; a speck weighs as much as a large label in a case's mean.
- Skull stripping. It cut into lesions at the brain's surface: label voxels where the four channels are zero, 26 of PatientID_0070's cavity, 17 of 0124's enhancing tissue and 10 of 0084's among the ten test cases drawn first, and 18% of development case PatientID_0187's cavity. No method can see anything there.
- Checks. On the 20 cases built first every channel and mask equals the package's file, and the enhancing tissue and the FLAIR hyperintensity read bright on their channels; on development case PatientID_0006 the enhancing tissue is no brighter after contrast, kept as delivered. The 18 added later were checked for grid, header and values 0 to 4.
- Room. The first ten test masks moved by one voxel keep a Dice of 0.86 to 0.94 for the FLAIR hyperintensity and, the specks apart, 0.69 to 0.94 for the enhancing tissue, 0.74 to 0.93 for the cavity and 0.63 to 0.84 for the core. The surface Dice at 1 mm forgives such a move.
- Outside numbers. BraTS 2024 scores lesion by lesion and on merged regions, so no published number is scored as here. Missouri gave about 400 post-treatment cases to BraTS 2024: a network trained on its data may have seen these patients.
- Overlap. No other descriptor names the collection or the University of Missouri. A registration dataset built later from MU-Glioma-Post should keep these test patients among its test cases and these development patients out of them.
| Accuracy | Cost | |||||||
|---|---|---|---|---|---|---|---|---|
| # | Method | Dice | Surface Dice | HD95 mm | Time s | RAM GB | GPU GB | Images |
| 1 | MONAI BraTS SegResNetGPUapp3 of 4 structures | 0.555 ±0.104 | 0.572 ±0.095 | 11.71 ±9.70 | 14 | 5.3 | 4.6 | |
The order averages each method's ranks on Dice, Surface Dice, HD95 mm, so the first one is not always the best in every column. ± is the 95% interval of the mean over the 20 cases. Two neighbours are tied when a paired Wilcoxon test on the shared cases does not find the upper one better on Dice (5%): the places a method could hold are then shown under its own. The best value of each column is in colour. Click a row to see its images, a column title to sort by it. Time and memory measured on Workstation.
Dice: how much the organ contours overlap, 1 is perfect. Surface Dice: the share of the contours' surfaces within a tolerance of each other, 1 is perfect. HD95: distance between the contours' surfaces.
Case by case
Click a score to look at that result: the image, the truth in green and the method's map in red. Underlined scores have their image; for the others you see the case without the result.
About the data
- Test cases
- 20 test patients drawn with seed 2026 among the 185 outside development, then 18 development patients, the last of the same seeded order. A case is a patient's earliest timepoint with a mask, so a patient is in one split, once. All 203 patients are in the pool, every mask holding a lesion; with one hospital, the draw has no strata.
- Truth
- contours by a program, verified by people the dataset's four labels, 1 the non-enhancing tumour core (its cystic, necrotic or haemorrhagic parts), 2 the surrounding non-enhancing FLAIR hyperintensity (infiltrative tumour and oedema), 3 the enhancing tissue, 4 the resection cavity: the FeTS pipeline's networks fused by STAPLE, every segmentation then corrected by a medical student, reviewed by two radiology residents and a neuroradiology fellow and approved by two board-certified neuroradiologists; the networks' output overlaps the final labels with a mean Dice of 0.96 to 0.99 (the data descriptor)
- Source
- www.cancerimagingarchive.net/collection/mu-glioma-post
doi.org/10.7937/7k9k-3c83
doi.org/10.1038/s41597-025-06011-7
www.cancerimagingarchive.net/wp-content/uploads/MU-Glioma-Post_ClinicalData-July2025.xlsx
www.cancerimagingarchive.net/wp-content/uploads/MR_Scanner_data.xlsx
arxiv.org/abs/2405.18368 - Licence
- CC BY 4.0
18 cases for tuning, never tested
PatientID_0006_Timepoint_2, PatientID_0047_Timepoint_1, PatientID_0066_Timepoint_1, PatientID_0117_Timepoint_1, PatientID_0196_Timepoint_1, PatientID_0161_Timepoint_1, PatientID_0024_Timepoint_2, PatientID_0187_Timepoint_1, PatientID_0258_Timepoint_1, PatientID_0206_Timepoint_1, PatientID_0139_Timepoint_1, PatientID_0038_Timepoint_1, PatientID_0212_Timepoint_1, PatientID_0053_Timepoint_1, PatientID_0021_Timepoint_2, PatientID_0010_Timepoint_1, PatientID_0094_Timepoint_1, PatientID_0173_Timepoint_1