 fidopt
Pretreat-MetsToBrain-Masks
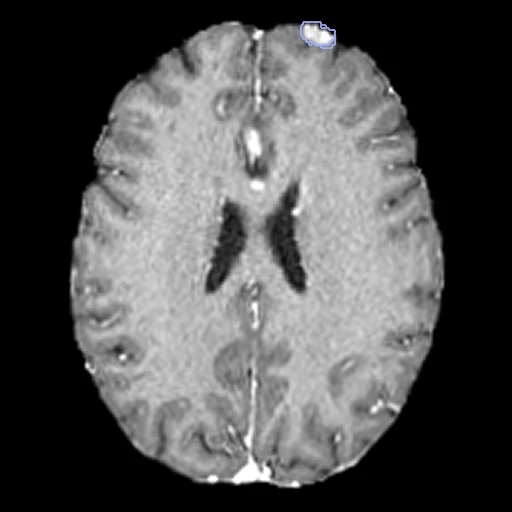
Pretreatment brain MR of a patient with brain metastases at Yale New Haven Hospital: T1, post-contrast T1, T2 and FLAIR as one four-channel image on the SRI24 atlas, every metastasis segmented in three parts.
Read before comparing (11)
- Pool. 200 Yale patients with a clinical or pathological diagnosis and a pretreatment MRI without significant motion, on 1 to 3 T scanners of four makers. The post-contrast T1 was 3D on 166 patients and 2D on 32; the FLAIR was 2D on 193.
- Images. One image of four channels, t1, t1c, t2 and flair: only a method that takes the four runs here. The provider registered each series rigidly to SRI24 at 1 mm and skull-stripped it; the values are the scanner's, on scales that differ between scanners. Some thick-slice post-contrast T1 stay blurred head to foot (00127, 00143, 00209).
- Brain. No mask is given: the brain is the foreground. Each sequence was skull-stripped apart, so the four brains differ at their surface, by 172 to 353 ml a case on the first 20 built. On 00089 skull stripping cut a lesion: 119 of its 267 oedema voxels lie where the post-contrast T1 is zero.
- Headers. 120 patients have the origin (120, 129, -68) mm and 80 the origin (0, -239, 0) mm, the brain at the same voxels: only the world position differs.
- Truth. A medical student segmented every lesion with a semi-automatic 3D tool; two board-certified neuroradiologists checked and revised each, one of them corrected the final masks in ITK-SNAP, and a second student checked them again. One segmentation a patient, no second reader: graded expert.
- Labels. 3, the enhancing tumour, is brighter on the post-contrast T1 than on the T1; 1, the necrosis, darker inside an enhancing lesion; 2, the oedema, the FLAIR hyperintensity around it. Each label is scored on its own, not as BraTS-METS's nested regions lesion by lesion, so no outside number compares.
- T1 hyperintensity. In no label. On test case 00127, a melanoma metastasis, 1.3 ml already bright before contrast is labelled 0, a hole in the mask; the T1, the first channel, tells it from enhancing tumour.
- Lesions. 975 enhancing lesions over the 200 patients, 1 to 51 a patient (median 2), with 0.014 to 47 ml of enhancing tumour (median 3.2 ml). The first ten test cases hold 21 lesions, 8 smaller than a ball 1 cm across. A label a case lacks is not scored there unless a method writes it, a false positive at 0.
- Room. Small lesions weigh on the Dice: moved by one voxel, the 20 test masks keep a Dice of 0.69 to 0.89 for the enhancing tumour (mean 0.81), 0.67 to 0.92 for the necrosis and 0.61 to 0.96 for the oedema. The surface Dice is at 1 mm, since the provider sets no tolerance.
- Exposure. The masks are public on TCIA and the folders carry BraTS-METS 2023 case names: a network trained on BraTS-METS data may have seen these patients.
- Overlap. No other dataset of the corpus holds them: no descriptor names the collection, Yale or BraTS-METS, and UCSDBrainMets is another hospital's cohort. A dataset built from Yale-Brain-Mets-Longitudinal, the same hospital's larger collection, would have to leave out the patients they share.
| Accuracy | Cost | |||||||
|---|---|---|---|---|---|---|---|---|
| # | Method | Dice | Surface Dice | HD95 mm | Time s | RAM GB | GPU GB | Images |
| 1 | MONAI BraTS SegResNetGPUapp | 0.493 ±0.122 | 0.468 ±0.114 | 34.89 ±15.77 | 3.4 | 2.9 | ||
The order averages each method's ranks on Dice, Surface Dice, HD95 mm, so the first one is not always the best in every column. ± is the 95% interval of the mean over the 20 cases. Two neighbours are tied when a paired Wilcoxon test on the shared cases does not find the upper one better on Dice (5%): the places a method could hold are then shown under its own. The best value of each column is in colour. Click a row to see its images, a column title to sort by it. Time and memory measured on Laptop.
Dice: how much the organ contours overlap, 1 is perfect. Surface Dice: the share of the contours' surfaces within a tolerance of each other, 1 is perfect. HD95: distance between the contours' surfaces.
Case by case
Click a score to look at that result: the image, the truth in green and the method's map in red. Underlined scores have their image; for the others you see the case without the result.
About the data
- Test cases
- 20 test patients drawn with seed 2026 among all 200, every one with at least one lesion in its mask, then 18 development patients, the last of the same seeded order. One hospital, so the draw has no strata.
- Truth
- contours by experts the dataset's three labels, 1 the necrosis of a metastasis, 2 the oedema around it with the tissue the tumour infiltrates, 3 its enhancing tumour: the whole lesion drawn on the FLAIR and the enhancing tumour and its necrosis on the post-contrast T1 by a medical student with a semi-automatic 3D tool, every segmentation checked and revised by two board-certified neuroradiologists, then corrected again by one of them on the final masks
- Source
- www.cancerimagingarchive.net/collection/pretreat-metstobrain-masks
doi.org/10.7937/6be1-r748
doi.org/10.1038/s41597-024-03021-9
doi.org/10.48550/arXiv.2309.05053
www.cancerimagingarchive.net/wp-content/uploads/Pretreat-MetsToBrain-Masks_clin_20240410.xlsx
cbica.github.io/CaPTk/preprocessing_brats.html
arxiv.org/abs/2306.00838 - Licence
- CC BY 4.0
18 cases for tuning, never tested
BraTS-MET-00104-000, BraTS-MET-00240-000, BraTS-MET-00224-000, BraTS-MET-00248-000, BraTS-MET-00206-000, BraTS-MET-00267-000, BraTS-MET-00310-000, BraTS-MET-00281-000, BraTS-MET-00166-000, BraTS-MET-00187-000, BraTS-MET-00144-000, BraTS-MET-00263-000, BraTS-MET-00226-000, BraTS-MET-00102-000, BraTS-MET-00276-000, BraTS-MET-00150-000, BraTS-MET-00096-000, BraTS-MET-00110-000