 fidopt
BraTS-Africa adult glioma
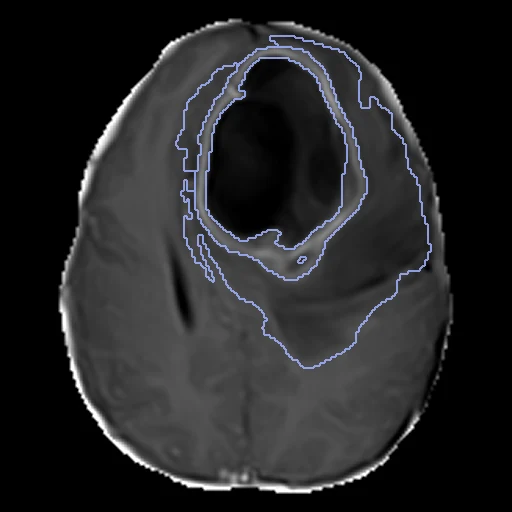
Brain MR of an adult with a presumed diffuse glioma, scanned at 1.5 T in Nigeria: T1, T1Gd, T2 and FLAIR as one four-channel image on the SRI24 atlas, with three tumour sub-regions labelled (BraTS-Africa).
Read before comparing (10)
- Pool. The package's 95 presumed adult diffuse gliomas, each with a label map, imaged in routine care on 1.5 T scanners at four Nigerian centres: NKDC 48, CRV 28, MEDHUB 14, LASUTH 5. The T1, T2 and FLAIR slices are 4 to 5 mm thick and stay blurred once resampled. These were BraTS 2023's BraTS-Africa data, 20 withheld then for its test; all are public now.
- Images. One image of four channels, T1, T1Gd, T2 and FLAIR, as the annotators read them; a method that reads one value a voxel picks its channel in its adapter. The provider registered the T1Gd rigidly to SRI24 at 1 mm and the other sequences to it, corrected the bias field and skull-stripped them. No mask: the brain is the foreground.
- Values. The provider's, untouched, on scales that differ between patients: the T1Gd's median in the brain is 426 to 865 on eight test cases but 3,117 and 3,713 on 00015 and 00025, which also go down to -401.
- Orientation. The header's axes are (-1, -1, 1) in ITK's LPS frame, where BraTS 2021's are (1, 1, 1). The spreadsheet flags four of the 95 as misoriented; two are here, test case 00220 and development case 00155, whose head lies turned in the grid. Their labels lie on the tumour, so they are kept; a method that expects the atlas's orientation may fail on them.
- Truth. A custom nnU-Net's pre-annotation, refined in ITK-SNAP by ten trained radiology residents, corrected by two board-certified radiologists and approved by an expert BraTS neuroradiologist. One map a patient, no second reader and no measure of agreement: graded semi-automatic.
- Labels. 1 the necrotic core, 2 the peritumoral oedema or infiltrated tissue, 3 the enhancing tumour, by BraTS 2023's definitions and numbers; the names are BraTS2021's, which numbers the enhancing tumour 4. Each label is scored on its own, not as BraTS's nested regions lesion by lesion, so the challenge's numbers do not compare.
- Cases. The ten test cases hold all three labels and large tumours, 37.6 to 408.5 ml. The smallest enhancing tumour is in 00092, which the spreadsheet calls a non-enhancing lower-grade glioma. Four test maps (00015, 00025, 00092, 00130) hold a few pieces of 1 to 33 voxels 38 to 82 mm from the tumour, kept as delivered.
- Room. The test labels moved by one voxel keep a Dice of 0.89 for the necrosis, 0.93 for the oedema and 0.88 for the enhancing tumour; the surface Dice is at 1 mm, since BraTS sets no tolerance. The paper finds these images of lower signal-to-noise and with more artefacts than TCGA-GBM's.
- Exposure. The 95 label maps are public: a network trained on BraTS data or on this collection may have seen these patients.
- Overlap. No other dataset of the corpus holds these patients: no descriptor names BraTS-Africa, BraTS-SSA or a Nigerian centre. A dataset built later from BraTS 2023's copy of the same 95 on Synapse, or from the 51 other tumours, leaves out the 20 used here.
| Accuracy | Cost | |||||||
|---|---|---|---|---|---|---|---|---|
| # | Method | Dice | Surface Dice | HD95 mm | Time s | RAM GB | GPU GB | Images |
| 1 | MONAI BraTS SegResNetGPUapp | 0.655 ±0.157 | 0.588 ±0.124 | 13.68 ±9.65 | 18 | 5.3 | 5.2 | |
The order averages each method's ranks on Dice, Surface Dice, HD95 mm, so the first one is not always the best in every column. ± is the 95% interval of the mean over the 10 cases. Two neighbours are tied when a paired Wilcoxon test on the shared cases does not find the upper one better on Dice (5%): the places a method could hold are then shown under its own. The best value of each column is in colour. Click a row to see its images, a column title to sort by it. Time and memory measured on Workstation.
1 result not ranked: an older run, cases still missing, or a failure on every case
| Accuracy | Cost | ||||||||
|---|---|---|---|---|---|---|---|---|---|
| # | Method | Dice | Surface Dice | HD95 mm | Time s | RAM GB | GPU GB | Machine | Images |
| MONAI BraTS SegResNetGPUappolder run | 0.655 ±0.157 | 0.588 ±0.124 | 13.68 ±9.65 | 5 | 3.4 | 2.9 | Laptop | ||
Dice: how much the organ contours overlap, 1 is perfect. Surface Dice: the share of the contours' surfaces within a tolerance of each other, 1 is perfect. HD95: distance between the contours' surfaces.
Case by case
Click a score to look at that result: the image, the truth in green and the method's map in red. Underlined scores have their image; for the others you see the case without the result.
About the data
- Test cases
- 10 test patients drawn with seed 2026 among the 85 gliomas outside development, in proportion by imaging centre: five from NKDC, three from CRV, one each from MEDHUB and LASUTH. 10 development patients, the last of the same seeded order, each centre in proportion (five from NKDC, three from CRV, two from MEDHUB). The package's 51 other tumours are not gliomas and stay out.
- Truth
- contours by a program, verified by people the dataset's three labels, 1 the necrotic tumour core, 2 the peritumoral oedematous or infiltrated tissue, 3 the enhancing tumour, by BraTS 2023's definitions: a custom nnU-Net's pre-annotation refined in ITK-SNAP by ten trained radiology residents, refined and corrected by two board-certified radiologists, and approved by an expert BraTS neuroradiologist
- Source
- www.cancerimagingarchive.net/collection/brats-africa
doi.org/10.7937/v8h6-8x67
doi.org/10.1148/ryai.240528
pmc.ncbi.nlm.nih.gov/articles/PMC12319694
www.cancerimagingarchive.net/wp-content/uploads/BraTS-Africa_TCIA_datainfo_v2.xlsx
doi.org/10.1007/978-3-030-46643-5_38 - Licence
- CC BY 4.0
10 cases for tuning, never tested
BraTS-SSA-00136-000, BraTS-SSA-00011-000, BraTS-SSA-00135-000, BraTS-SSA-00122-000, BraTS-SSA-00210-000, BraTS-SSA-00049-000, BraTS-SSA-00126-000, BraTS-SSA-00056-000, BraTS-SSA-00155-000, BraTS-SSA-00226-000