 fidopt
PLC-CECT
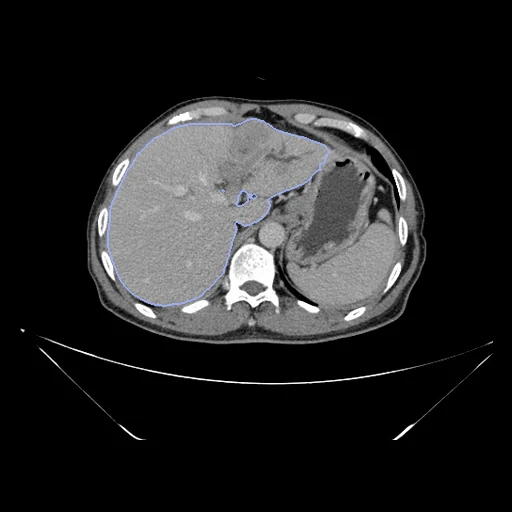
Contrast-enhanced liver CT of one patient with primary liver cancer before treatment: the delayed phase (fixed) and the arterial phase (moving) of one examination (PLC-CECT, Chongqing Yubei District People's Hospital).
Read before comparing (9)
- Phases. Delayed and arterial are the two phases furthest apart, minutes apart, with the most different enhancement: the aorta, the arteries and early-enhancing tumours are bright on the arterial image only. They also share their slice step, which the plain and venous phases often do not.
- Geometry. The files lost it: every image says 1 mm in each direction with its origin at zero, while the paper gives 512 x 512 pixels over a 400 mm field and 0.8 mm slices; many files keep slices further apart, by a step the pages do not give. The millimetres of HD95 and of the fields are voxels. Ranked apart for that reason, with LiverMetsCT.
- Values. 8-bit, 0 to 255: the paper's -200 to 200 HU window mapped onto 0 to 255 by a rule the pages do not state, kept as delivered. Air and lung read 0, bone and the arterial aorta 255: nothing to register there.
- Slice step. On the first 20 inspected pairs the arterial and delayed CTs cover the liver with 0.83 to 1.11 times as many slices, which the liver's movement can explain, but on P0095 (0.83, development) the vertebrae differ too. Over the archive their files differ in size by more than 1.4 times for 12 of the 278 patients with cancer.
- Cropping. On each phase the clinicians kept the slices that hold the liver, the files keeping up to 41 beyond it at one end. The two images of a pair therefore start at different levels, which their zero origins do not record.
- Baseline. Both volumes keep their native grids, and the moving header carries one intensity-only elastix translation from the arterial to the delayed phase. From there the 27 test patients start at a liver Dice of 0.933 at the median (0.794 to 0.968, two just below 0.8), an HD95 of 6.782 file voxels (3.317 to 26.907) and a median lesion Dice of 0.736.
- Truth. Each phase's liver mask is the LiverMask network's segmentation refined by clinicians in ITK-SNAP. Two clinicians drew the lesions on their own, viewing the four phases, then reconciled them from a mean Dice of 0.76. A lesion is small and its visible extent changes with enhancement: shown (dice_lesion), never ranked. P0165's arterial lesion mask is empty (development).
- Images. P0116 (test) and P0165 carry a viewer's rulers and text burned in outside the body. Some CT files are RGB, and prepare.py keeps the first channel.
- Pool. One centre, 2015 to 2022, and two scanners (Canon Aquilion PRIME, Philips Brilliance iCT); patient_data.csv does not say which scanner a patient had. The patients had no tumour treatment and were scanned within two weeks before surgery. Built from version 4 of the Science Data Bank record (May 2025); the paper cites version 3.
| Accuracy | Smoothness | Cost | ||||||||
|---|---|---|---|---|---|---|---|---|---|---|
| # | Method | Dice | Change | HD95 mm | SDlogJ | Folds % | Time s | RAM GB | GPU GB | Images |
| 1 | ConvexAdam (MIND)GPUapp | 0.964 ±0.008 | +0.058 | 5.10 ±1.17 | 0.046 | 0.05 | 25 | 4.4 | 10.5 | |
| 2 | DemonsCPUapp | 0.948 ±0.009 | +0.042 | 6.31 ±1.54 | 0.033 | 0.00 | 32 | 5.4 | ||
| No registration | 0.907 ±0.022 | 8.84 ±2.14 | 0.000 | 0.00 | ||||||
The order averages each method's ranks on Dice, HD95 mm, SDlogJ, so the first one is not always the best in every column. ± is the 95% interval of the mean over the 27 pairs. Two neighbours are tied when a paired Wilcoxon test on the shared pairs does not find the upper one better on Dice (5%): the places a method could hold are then shown under its own. The best value of each column is in colour. Click a row to see its images, a column title to sort by it. Time and memory measured on Laptop.
Dice: how much the organ contours overlap, 1 is perfect. HD95: distance between the contours' surfaces. SDlogJ: how irregular the deformation is, 0 is perfectly smooth. Folds: share of the image where the deformation folds over itself.
Pair by pair
Click a score to look at that result: the fixed image, and over it the moving image after registration, with the annotations. Underlined scores have their image; for the others you see the pair without the result. A green cell gained against no registration on that pair, a red one lost.
About the data
- Test pairs
- 27 test and 24 development patients drawn without overlap with seed 2026, stratified by cancer type, from 271 eligible patients with cancer; the first three development pairs are the lowest-numbered patient of each type, the others the last of the same seeded order, those the test draw rests on kept, each type in proportion: 8 HCC, 9 ICC and 7 cHCC-CCA in all. The 83 control patients, without lesion masks, are not drawn, nor the seven patients prepare.py names (no delayed phase, or empty liver masks).
- Truth
- contours by experts lesion by experts the liver (label 1) on each phase: the LiverMask network's segmentation refined by clinicians in ITK-SNAP
- Source
- doi.org/10.57760/sciencedb.12207
doi.org/10.1038/s41597-025-05125-2
github.com/ljwa2323/PLC_CECT - Licence
- CC BY 4.0
24 pairs for tuning, never tested
P0001, P0095, P0194, P0165, P0162, P0115, P0171, P0024, P0113, P0119, P0155, P0033, P0111, P0075, P0062, P0088, P0035, P0266, P0041, P0217, P0272, P0228, P0203, P0246