 fidopt
SNEMI3D sections, known in-plane deformation
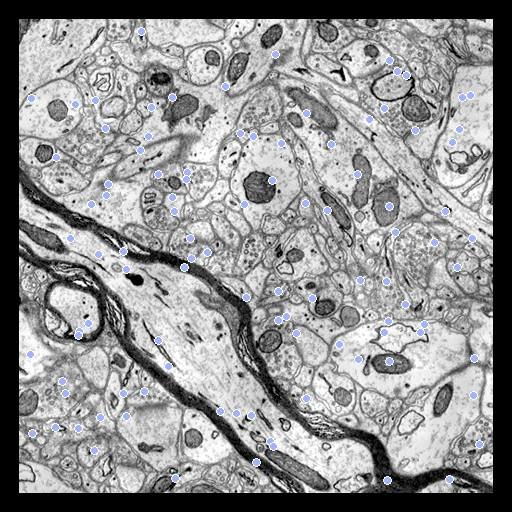
A mouse cortex serial-section electron microscopy image paired with a known smooth deformation of itself: it measures the recovery of a known in-plane warp, not the alignment of adjacent sections.
Read before comparing (4)
- Truth. Both sides are the same original section before the warp, since a known warp applied to a neighbouring section would not make its correspondence exact. The reference points lie at least 20 pixels inside every border, beyond the 16-pixel bound on each deformation component, and every inverse-warped point is checked inside the image.
- Units. Coordinates and distances are in pixels; no physical scale is read from the uncalibrated TIFF metadata. The build fields amplitude_mm and spacing_mm hold pixel values here.
- Labels. The provider's test stack has no public neurite labels, and the synthetic truth does not use them. The training stack's instance labels are not turned into a segmentation task.
- Baseline. Fixed and moving are one image before the warp, so any single-modality similarity recovers it: ANTs SyN ends at 0.05 to 0.11 pixel from a start of 5.2 to 6.5 on the ten test sections. The line checks a method's convention and interpolation more than it separates methods.
| Accuracy | Smoothness | Cost | |||||||
|---|---|---|---|---|---|---|---|---|---|
| # | Method | TRE px | rTRE | SDlogJ | Folds % | Time s | RAM GB | GPU GB | Images |
| 11–6 | vismatch matchers · LoFTRGPU | 5.48 ±0.28 | 0.0038 ±0.0002 | 0.002 | 0.00 | 4 | 2.1 | 7.9 | |
| 11–6 | vismatch matchers · RoMaGPU | 5.55 ±0.25 | 0.0038 ±0.0002 | 0.001 | 0.00 | 8 | 3.3 | 6.9 | |
| 31–6 | vismatch matchers · XFeatGPU | 5.59 ±0.28 | 0.0039 ±0.0002 | 0.003 | 0.00 | 3 | 2.3 | 0.5 | |
| 41–6 | vismatch matchers · ALIKED + LightGlueGPU | 5.64 ±0.29 | 0.0039 ±0.0002 | 0.003 | 0.00 | 3 | 2.4 | 2.2 | |
| 41–6 | vismatch matchers · SIFT + LightGlueGPU | 5.81 ±0.46 | 0.0040 ±0.0003 | 0.003 | 0.00 | 3 | 2.1 | 0.5 | |
| 61–6 | vismatch matchers · DISK + LightGlueGPU | 5.90 ±0.43 | 0.0041 ±0.0003 | 0.004 | 0.00 | 3 | 2.2 | 3.8 | |
The order averages each method's ranks on TRE px, SDlogJ, so the first one is not always the best in every column. ± is the 95% interval of the mean over the 10 pairs. Two neighbours are tied when a paired Wilcoxon test on the shared pairs does not find the upper one better on TRE px (5%): the places a method could hold are then shown under its own. The best value of each column is in colour. Click a row to see its images, a column title to sort by it. Time and memory measured on Laptop.
TRE: distance between matching landmarks. rTRE: the TRE over the length of the image's diagonal, to compare datasets of other sizes and units. SDlogJ: how irregular the deformation is, 0 is perfectly smooth. Folds: share of the image where the deformation folds over itself.
Pair by pair
Click a score to look at that result: the fixed image, and over it the moving image after registration, with the annotations. Underlined scores have their image; for the others you see the pair without the result. A green cell gained against no registration on that pair, a red one lost.
About the data
- Test pairs
- 10 test sections from the provider's test stack and 10 development sections from its training stack. Both stacks come from one animal, and neighbouring sections are correlated: a stack-separated synthetic track, not an animal-independent split.
- Truth
- landmarks a known deformation One hundred interior image points paired through the inverse of the corpus-added B-spline deformation of that same section.
- Licence
- CC BY 4.0, Zenodo record 7142003
10 pairs for tuning, never tested
train_z030, train_z006, train_z082, train_z031, train_z067, train_z049, train_z022, train_z043, train_z058, train_z016