 fidopt
SHG/BF TMA cores (Eliceiri)
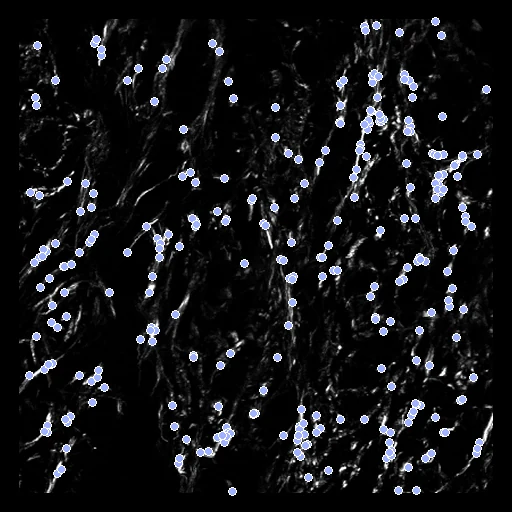
A second-harmonic generation image (SHG, fixed) and a bright-field image (moving) of one H&E-stained breast carcinoma tissue microarray core, the central 834 x 834 px patch, the bright-field deformed by a known smooth transform.
Read before comparing (10)
- Images. Two microscope images of one section, from the Laboratory for Optical and Computational Instrumentation (University of Wisconsin-Madison). SHG is label-free and shows the fibrillar collagen; the bright-field image shows the stain and stays in colour, one vector of red, green and blue a pixel. Each pair is the central patch of a core's 2048 x 2048 px images.
- Tissue. The record names Conklin et al. 2011's array of breast cancer cores as the source; Learn2Reg 2024 describes the same images as breast and pancreatic cancer tissue. The release names no patient, so whether a patient has several cores is not stated.
- Units. No pixel size is given, so distances are in pixels and prepare.py sets every spacing to 1. The rTRE divides by the image's diagonal, 1179 px.
- Truth. Synthetic, ranked apart: a cubic B-spline (knots 160 px apart, coefficients within 60 px) deforms the bright-field image, and 300 points drawn on the collagen, where the SHG image is above its Otsu threshold, are paired through it. The release's own truth is a random rigid move a start would remove, and Learn2Reg 2024's hand-placed landmarks on these patches are not public.
- Alignment. The release aligned each pair by hand from landmark pairs, used as delivered. That alignment is off by 1 to 8 px on 15 of the 16 cores first built from slide 1B and 8 to 18 px on the four from 2B, an error inside the truth. Elastix's translation was left out: it moved the patch by 80 to 510 px on 13 of the 38 pairs.
- Scored region. The points lie on the collagen, so the cell-rich regions between are not scored. Where the deformation reaches past the bright-field image, 1.8 to 6.3% of it on the test cases, the image's minimum fills it; every point pair lies inside both images. 1B_I2, 1B_J7, 2B_G4, 2B_H1 and 2B_H2 hold only faint fibres and stay cases.
- Baseline. With no registration the 20 test pairs score a TRE of 21.4 px (14.9 to 27.3), rTRE 0.018, its 95th percentile 27 to 46 px. The deformation moves the points by up to 52 px, its Jacobian determinant between 0.56 and 1.67.
- Baselines. On the test pairs first built, none of the corpus's beat no registration: NiftyReg (reg_f3d, NMI), given the mean of the bright-field channels, ended at 22.6 px against 21.6, ANTs' SyN at 22.4 px, worse on seven pairs. A similarity of raw intensities finds little correspondence between collagen and stain: these pairs need one made for the two modalities.
- Outside numbers. None: Learn2Reg 2024 scored these images from a large start (69.6 px) against its hidden landmarks, down to 2.6 px for the best entry, another start and another truth.
- No method here does better than no registration on TRE (21.36): as far as these annotations can tell, the pairs already match.
| Accuracy | Smoothness | Cost | ||||||||
|---|---|---|---|---|---|---|---|---|---|---|
| # | Method | TRE px | Change | rTRE | SDlogJ | Folds % | Time s | RAM GB | GPU GB | Images |
| 1 | NiftyRegCPUapp | 22.72 ±1.51 | +1.35 | 0.0193 ±0.0013 | 0.467 | 0.37 | 2 | 0.2 | ||
| No registration | 21.36 ±1.62 | 0.0181 ±0.0014 | 0.000 | 0.00 | ||||||
The order averages each method's ranks on TRE px, SDlogJ, so the first one is not always the best in every column. ± is the 95% interval of the mean over the 20 pairs. Two neighbours are tied when a paired Wilcoxon test on the shared pairs does not find the upper one better on TRE px (5%): the places a method could hold are then shown under its own. The best value of each column is in colour. Click a row to see its images, a column title to sort by it. Time and memory measured on Laptop.
TRE: distance between matching landmarks. rTRE: the TRE over the length of the image's diagonal, to compare datasets of other sizes and units. SDlogJ: how irregular the deformation is, 0 is perfectly smooth. Folds: share of the image where the deformation folds over itself.
Pair by pair
Click a score to look at that result: the fixed image, and over it the moving image after registration, with the annotations. Underlined scores have their image; for the others you see the pair without the result. A green cell gained against no registration on that pair, a red one lost.
About the data
- Test pairs
- 20 test cores drawn with seed 2026 among the 186 outside development, from the two slides in proportion (eleven from 1B, nine from 2B), then 18 development cores, the last of the same seeded order, those the test draw rests on kept, twelve from 1B and six from 2B. The pool is 204 of the record's 206 pairs, one core a case: 1B_L10 and 2B_H10, whose SHG images hold no tissue, are left out.
- Truth
- landmarks a known deformation 300 points drawn in the SHG image's foreground (the collagen), paired through the known deformation of the bright-field image
- Source
- zenodo.org/records/3874362
zenodo.org/records/4550300
doi.org/10.1364/BOE.11.000160
arxiv.org/abs/2006.06325
doi.org/10.1016/j.ajpath.2010.11.076
learn2reg.grand-challenge.org/learn2reg-2024
cloud.imi.uni-luebeck.de/s/dPtMi8fiopkSgCA
arxiv.org/abs/2509.01217
github.com/MDL-UzL/L2R - Licence
- CC BY 4.0
18 pairs for tuning, never tested
1B_K4, 1B_B7, 1B_G5, 1B_D3, 1B_I6, 1B_C4, 1B_H5, 1B_G1, 1B_D10, 1B_K7, 2B_H8, 2B_D4, 2B_B8, 2B_A6, 2B_F7, 2B_D3, 1B_L1, 1B_G7