 fidopt
Mouse whole-body micro-CT
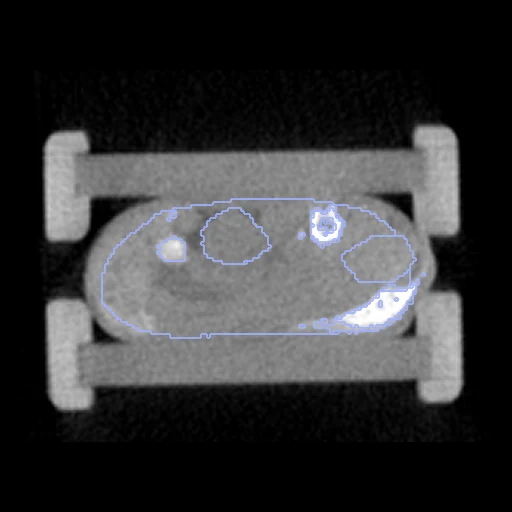
Whole-body micro-CT of one mouse at its first and its last time point, anaesthetised and positioned anew in between, with its organs labelled on both (Rosenhain et al., preclinical micro-CT database).
Read before comparing (10)
- Case. The fixed image is a mouse's first scan and the moving one its last, the two furthest apart: 0.25 h and 72 h on the native mice, from -001h or 0.25 h to 24, 72 or 240 h on the contrast-enhanced ones. In between, the posture changes and the bladder, stomach and intestine fill or empty.
- Truth. The dataset's maps: bone and lung by threshold and region growing, heart, bladder and kidneys drawn on a few slices and interpolated, stomach and intestine as a few convex regions drawn by hand, the liver slab by slab. Graded by the weakest organ: semi-automatic.
- Agreement. A second evaluator's maps agree at a Dice of 0.37 to 0.92 by organ (paper, Table 3), 0.37 on the native spleen, which the native scans hardly show: a level no registration can be expected to pass. Where a scan has two maps, Organ1 is taken.
- Labels. What is drawn changes between scans more than the anatomy: the last scan holds 0.08 to 2.4 times the first's bladder, 0.37 to 2.9 its stomach, 0.30 to 2.0 its spleen, 0.25 to 2.0 its lung and 0.76 to 1.23 its liver. Part of what a perfect registration leaves belongs to the truth. A label is scored where both scans hold it; bone and stomach are drawn on native M01 to M05 only.
- Shown apart. dice_thigh, a part of the thigh muscle drawn over an extent each evaluator chose, and dice_tumour, the contrast-enhanced mice's A431 tumour, which grows 1.9 to 8.0 times between the scans, are shown, never ranked: the tumour's overlap rewards a field that stretches the small tumour over the large one.
- Contrast. The liver and spleen take up the contrast-enhanced mice's ExiTron nano 6000, the spleen brightening further by the last scan (725 to 1356 HU): their intensities change within a pair.
- Images. Hounsfield units on the dataset's 0.28 mm grid, where the cortical bone is one or two voxels thick: a fraction of a millimetre off and its Dice falls. The contrast-enhanced images keep the whole 43 x 34 x 68 mm field; the native ones are cut around the mouse.
- Alignment. The files carry no position or orientation. The moving image's header carries one translation from elastix mutual information inside each body, the best of several starts, no annotation used, moving the mouse by 6 mm at most; a rigid fit would turn it by only 0.2 to 3.4 degrees. The mask is the body, from the Bed map.
- Baseline. With no registration the test pairs score a Dice of 0.43 (0.13 to 0.62), an HD95 of 4.1 mm (1.9 to 11.8) and 0.19 (0.02 to 0.33) on the tumours. What is left is the posture and the organs' own movement, several millimetres in a mouse 25 to 30 mm wide.
- Archive. The archive and the paper's Table 2 differ on the time points of M05, M06 and M01; the corpus follows the archive's folders. No outside number compares: the dataset was published for segmentation.
| Accuracy | Smoothness | Cost | ||||||||
|---|---|---|---|---|---|---|---|---|---|---|
| # | Method | Dice | Change | HD95 mm | SDlogJ | Folds % | Time s | RAM GB | GPU GB | Images |
| 1 | ConvexAdam (MIND)GPUapp | 0.627 ±0.168 | +0.199 | 3.04 ±2.07 | 0.078 | 0.16 | 6 | 2.2 | 1.2 | |
| No registration | 0.428 ±0.119 | 4.10 ±2.17 | 0.000 | 0.00 | ||||||
The order averages each method's ranks on Dice, HD95 mm, SDlogJ, so the first one is not always the best in every column. ± is the 95% interval of the mean over the 10 pairs. Two neighbours are tied when a paired Wilcoxon test on the shared pairs does not find the upper one better on Dice (5%): the places a method could hold are then shown under its own. The best value of each column is in colour. Click a row to see its images, a column title to sort by it. Time and memory measured on Laptop.
Dice: how much the organ contours overlap, 1 is perfect. HD95: distance between the contours' surfaces. SDlogJ: how irregular the deformation is, 0 is perfectly smooth. Folds: share of the image where the deformation folds over itself.
Pair by pair
Click a score to look at that result: the fixed image, and over it the moving image after registration, with the annotations. Underlined scores have their image; for the others you see the pair without the result. A green cell gained against no registration on that pair, a red one lost.
About the data
- Test pairs
- 10 test mice drawn with seed 2026 among the 18 outside development, 2, 5 and 3 from the OsteoSense native mice (M01 to M05), the other native mice and the contrast-enhanced mice, and 10 development mice. The native mice's other probe groups are not named. Contrast-enhanced M09 and M10 were scanned once: no pair.
- Truth
- contours by a program, verified by people tumour by experts thigh by experts the dataset's organs on each scan, one numbering for all: liver (1), heart (2), lung (3), trachea (4), spleen (5), kidneys (6), stomach (7), intestine (8), bladder (9), bone (10); bone and lung found by a threshold and region growing from a seed point, the heart, liver, kidneys, stomach, intestine and bladder drawn by hand (notes)
- Licence
- CC0 1.0
10 pairs for tuning, never tested
native_M10, contrast_M05, native_M20, native_M01, native_M07, contrast_M03, native_M16, native_M19, native_M04, contrast_M08