 fidopt
Mouse whole-body CT and MRI
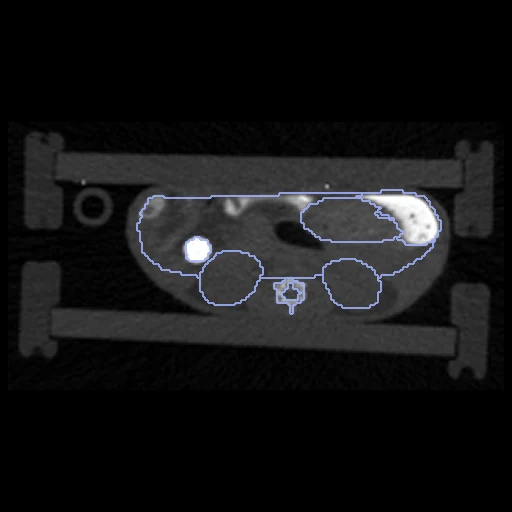
Micro-CT (fixed) and 7 T MRI (moving) of one mouse, scanned one after the other in one animal holder 4.5 hours after an injection (Preclinical CT and MRI liver imaging dataset, Aachen).
Read before comparing (10)
- Alignment. The CT and the MRI come in their scanners' frames, 72 to 85 mm apart. The provider fused them through 45 petrolatum markers in the holder, residuals under 0.5 mm, and prepare.py puts the MRI in the CT's frame by that rigid transform alone, a turn of 0.7 to 3.8 degrees: an alignment from the markers, not the organs.
- Baseline. With no registration the test pairs score a Dice of 0.68 (0.58 to 0.78) and an HD95 of 2.7 mm (1.4 to 4.5), by organ from 0.78 for the heart and lungs to 0.44 for the colon, whose poor match the paper puts down to its motion. What is left is motion and the two maps' differences.
- Truth. The organ maps were made in Imalytics Preclinical, on the CT and on the MRI separately; no source says who made them or how. Graded provider: the dataset passes two of the main board's three checks but not the first, people on both images, so it is ranked apart until the authors say how the maps were made (corresponding author Fabian Kiessling).
- Two readings. The two maps are two readings in two contrasts: the MRI's kidneys hold 0.95 to 1.98 times the CT's, its stomach 0.83 to 2.31 times. Part of what a perfect registration leaves on these labels belongs to the truth, not to the method.
- Labels. Eight organs are scored where both maps hold them. The heart and lungs are one label, as the MRI cannot tell them apart. Bone is on the CT only; brain, spinal cord, gallbladder and thyroid on the MRI only; none of these is scored. The CT's liver holds the gallbladder, the MRI's leaves it out.
- Spleen. Only partly segmented on the CT: the MRI's spleen holds 1.9 to 34 times the CT's, and as delivered the two overlap at 0.21 (0 to 0.47). It is shown (dice_spleen), never ranked; M29's CT map has none.
- Images. The CT, on the provider's 0.14 mm grid, comes in Hounsfield units plus 1000: prepare.py subtracts 1000 and rounds. Oral contrast fills the caecum and colon, 1128 to 4209 HU at the median. The moving image is the MRI's mixed Dixon channel, the mean of water and fat, its values without unit.
- Field. The field is asked on the CT's grid, 57 to 66 million voxels. The CT holds the whole mouse over 116 mm, the MRI a zero-padded slab of 80 mm from the head to the pelvis, 17.6 mm thick. Every scored organ lies in the slab but the end of the colon of M27 (3% out) and of M33 (development, 8% out).
- Cohort. 12 healthy female nude mice injected with labelled immunoglobulins; which antibody each received is not said, so the draw is not stratified.
- Outside numbers. The paper ranks fluorescence reconstructions, not registration. Its CT-MRI organ overlaps after the fusion match this dataset's no-registration line: liver 0.74, heart and lungs 0.78, kidneys 0.65, colon 0.43, against 0.73, 0.78, 0.65 and 0.44 here.
No method has a result on every pair of this dataset yet.
| Accuracy | Smoothness | Cost | ||||||||
|---|---|---|---|---|---|---|---|---|---|---|
| # | Method | Dice | Change | HD95 mm | SDlogJ | Folds % | Time s | RAM GB | GPU GB | Images |
| No registration | 0.679 ±0.047 | 2.68 ±0.71 | 0.000 | 0.00 | ||||||
Dice: how much the organ contours overlap, 1 is perfect. HD95: distance between the contours' surfaces. SDlogJ: how irregular the deformation is, 0 is perfectly smooth. Folds: share of the image where the deformation folds over itself.
Pair by pair
Click a score to look at that result: the fixed image, and over it the moving image after registration, with the annotations. Underlined scores have their image; for the others you see the pair without the result. A green cell gained against no registration on that pair, a red one lost.
About the data
- Test pairs
- 10 test mice drawn with seed 2026 among the 12, all of which have both images and both maps at 4.5 hours, the other 2 for development. The pair of one modality across the two sessions is left out: the mouse is placed in the holder anew, M24 has no MRI at the first session, and MouseMicroCT already holds that task.
- Truth
- contours as released spleen as released the dataset's organ maps, made on the CT and, separately, on the MRI in Imalytics Preclinical (who made them and how is not stated), one numbering for both: liver (1), heart and lungs (2), kidneys (3), stomach (4), small intestine (5), caecum (6), colon (7), bladder (8), scored where both maps hold them; bone (9) on the CT only, brain (10), spinal cord (11), gallbladder (12) and thyroid (13) on the MRI only, never scored
- Source
- doi.org/10.5281/zenodo.17130082
catgonzftw1.github.io/preclinical_imaging/Liver_Imaging_V8_S3/files.html
doi.org/10.1038/s41597-026-07003-x
doi.org/10.1097/RLI.0000000000001052 - Licence
- CC BY 4.0
2 pairs for tuning, never tested
M31, M33