 fidopt
MMB-MRI
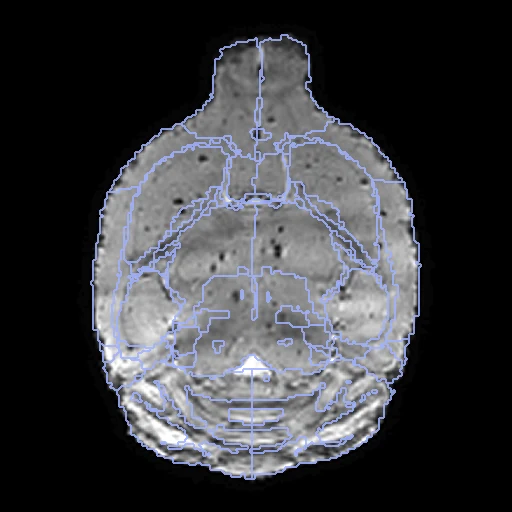
T2-weighted MR at 11.7 T of the skull-stripped brains of two C57BL/6J mice, with 50 regions labelled (MMB-MRI, the 47 mice whose labels were corrected by hand).
Read before comparing (10)
- Mice. cohort_47mouse's C57BL/6J brains; their age, sex and whether they were scanned alive are not stated. The 28 mice of cohort_28mouse, whose labels were mapped from the atlas and not corrected, are not used. The case ids' prefixes w, wlh and wcon are unexplained; the draw is not stratified by them.
- Truth. The Dorr atlas's 114 labels, consolidated into 50 regions, mapped onto each brain, then corrected by hand by researchers familiar with mouse anatomy. How much was corrected, by how many people, and how well they agree are not stated. Where the image shows no edge the boundary is the atlas's: graded semi-automatic.
- Image. The T2-weighted image, of the six each mouse has, as the provider processed it (brain extraction, registration, N4, intensity normalisation): 0.07 mm, values without unit reaching 1.5 to 2.6, 9 to 10% of the brain's voxels negative, the background 0. No mask is given.
- Alignment. The provider's processing included affine and deformable registration across subjects. The corpus adds one elastix translation on the intensities, no label used, written in the moving image's and truth's headers; native voxels kept.
- Baseline. With no registration the ten test pairs score a mean Dice of 0.7243 (0.6564 to 0.7772) and an HD95 of 0.1869 mm (0.1419 to 0.2373).
- Room. On the earlier label-centroid affine build, greedy, NiftyReg and ANTs SyN at their defaults brought the images closer and the labels further apart (greedy 0.76, NiftyReg 0.70), losing most in the small deep regions the T2 hardly shows: a field that moves less scores better. Those scores do not compare with the current build.
- Sides. Nothing in a mouse brain tells left from right: the sides are the header's and agree with the Dorr atlas's numbering; prepare.py checks that each left region lies left of its counterpart.
- Unlabelled. 25 to 28% of the skull-stripped image is unlabelled, mostly a rim within 0.4 mm of a label, plus thin structures, the gap between the olfactory bulbs and the caudal brainstem.
- Same session. w20191009_120043 series 3 (development) and series 7 (test) share a session time but are two mice: their T2s match no better than two other mice's.
- Outside numbers. None: the pairing is ours.
| Accuracy | Smoothness | Cost | ||||||||
|---|---|---|---|---|---|---|---|---|---|---|
| # | Method | Dice | Change | HD95 mm | SDlogJ | Folds % | Time s | RAM GB | GPU GB | Images |
| 1 | ConvexAdam (MIND)GPUapp | 0.775 ±0.026 | +0.051 | 0.15 ±0.02 | 0.035 | 0.00 | 5 | 2.3 | 1.6 | |
| 2 | DemonsCPUapp | 0.626 ±0.092 | −0.098 | 0.29 ±0.09 | 0.023 | 0.00 | 2 | 0.8 | ||
| No registration | 0.724 ±0.031 | 0.19 ±0.03 | 0.000 | 0.00 | ||||||
The order averages each method's ranks on Dice, HD95 mm, SDlogJ, so the first one is not always the best in every column. ± is the 95% interval of the mean over the 10 pairs. Two neighbours are tied when a paired Wilcoxon test on the shared pairs does not find the upper one better on Dice (5%): the places a method could hold are then shown under its own. The best value of each column is in colour. Click a row to see its images, a column title to sort by it. Time and memory measured on Laptop.
Dice: how much the organ contours overlap, 1 is perfect. HD95: distance between the contours' surfaces. SDlogJ: how irregular the deformation is, 0 is perfectly smooth. Folds: share of the image where the deformation folds over itself.
Pair by pair
Click a score to look at that result: the fixed image, and over it the moving image after registration, with the annotations. Underlined scores have their image; for the others you see the pair without the result. A green cell gained against no registration on that pair, a red one lost.
About the data
- Test pairs
- 10 test pairs drawn with seed 2026 among the 13 outside development, and 10 development pairs. The 47 mice, put in the order of sha256("2026:MouseBrainMR:<case_id>") and paired two by two, make 23 pairs, each mouse in one; w20191111_111733MGEs30001a001 is left out.
- Truth
- contours by a program, verified by people the dataset's 50 regions on each brain: the 114 labels of the Dorr mouse brain atlas consolidated into 50 regions (label_mapping.csv), mapped onto each brain, then corrected by hand and quality controlled by researchers familiar with mouse brain anatomy; 21 regions come once a side and 8 once for the brain (the midbrain, the pons, the medulla, the third and fourth ventricles, the interpeduncular nucleus, and the globus pallidus and the lateral ventricles, each of both sides together); the thalamus holds the hypothalamus and the mammillary bodies, the olfactory bulbs the olfactory tubercle and the lateral olfactory tract; 23 atlas labels of 13 small structures (tracts, commissures, the cerebral aqueduct, the fundus of the striatum, two nuclei of the medulla) are background
- Source
- doi.org/10.57760/sciencedb.nb.00057
www.scidb.cn/detail?dataSetId=ce6faef5c96046fab55b9db6ee112793
api.datacite.org/dois/10.57760/sciencedb.nb.00057
china.scidb.cn/download?fileId=af66303caf1bad9913172b34c1a53694
china.scidb.cn/download?fileId=5039f900e55948f1638a1f0b3035583d
china.scidb.cn/download?fileId=886fc2a201d56258236fbdd24e8f0d95
www.mouseimaging.ca/repo/DSURQE_40micron/Dorr_2008_Steadman_2013_Ullmann_2013_Richards_2011_Qiu_2016_Egan_2015_40micron/mappings/DSURQE_40micron_R_mapping.csv - Licence
- CC BY 4.0
10 pairs for tuning, never tested
w20191006_154454MGEs40001a001_w20191009_152924MGEs40001a001, w20190929_184526MGEs60001a001_w20191111_132007MGEs20001a001, w20191006_144359MGEs40001a001_w20190929_104242MGEs50001a001, w20191006_185221MGEs40001a001_w20190929_125158MGEs60001a001, w20190929_203552MGEs80001a001_wlh_20191006_213508MGEs40001a001, w20191009_120043MGEs30001a001_w20191006_103531MGEs80001a001, w20191009_131839MGEs60001a001_w20191027_192010MGEs40001a001, w20190929_193910MGEs60001a001_w20191009_193654MGEs40001a001, w20191006_195335MGEs50001a001_w20191006_134349MGEs40001a001, w20190929_115000MGEs50001a001_w20191027_171956MGEs40001a001