 fidopt
Brain/MINDS marmoset in vivo and ex vivo T2 MRI
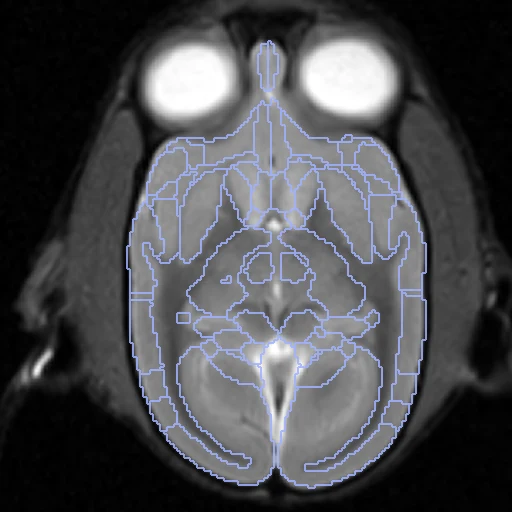
The in vivo and the ex vivo, fixed, T2-weighted images of one marmoset, with the provider's 52 atlas regions a hemisphere on each.
Read before comparing (9)
- Case. One animal before and after death: the brain in the head, then dissected and fixed. The ex vivo file names give the in vivo number (T2WI_ex004_i031.nii.gz). Only the T2-weighted images and the Label052 maps are used.
- Images. The provider's files, unchanged, each on its own grid: the in vivo at 0.27 mm, the ex vivo at 0.1 mm. The ex vivo maps come on a larger grid than their image and are placed on it by their position in the world, nearest neighbour; the labelled volume changes by under 5% on every case.
- Left and right. Under their headers the in vivo maps hold regions 1 to 52 on the animal's left and the ex vivo maps on its right, in all 21 animals looked at and in the standard brains NA216 and eNA91; an affine on mutual information also ends better from a rotation than from a reflection in 20 of the 21. prepare.py therefore swaps the ex vivo numbers (k and k + 52).
- Sides. The alignment is a rotation and a translation, never a reflection. Which side is the animal's true left is not proved, the provider not saying: left and right are those of the in vivo header, the living animal lying supine in the scanner. The pairing of the regions between the two images does not depend on it.
- Held out. On i134__ex022 the reflection wins clearly (mutual information 0.68 against 0.52): its ex vivo image is the mirror of its in vivo one under the headers, and no rotation pairs them.
- Alignment. One rigid start from the intensities alone (elastix-rigid-centred), written in the ex vivo image's and labels' headers: elastix on mutual information inside each image's body, from the bodies' and images' centres only, since the ex vivo brain is part of the in vivo head. No label is used. The fixed brain's shrinkage is left to the methods: affine fits scale it by about 0.9 in volume.
- Baseline. After the start the regions overlap 0.60 on average on the ten test pairs (0.53 to 0.69), HD95 0.64 mm. The two maps of an animal are separate propagations of the atlas, each with its own error, so a perfect registration would not reach 1: differences of a few hundredths between methods are within the truth's own noise.
- Ranked apart. The truth is an atlas propagated by registration (ANTs), which may favour methods like the one that made it.
- Overlap. The animals of the Brain/MINDS tracer cohort (MarmosetSTPT) carry other identifiers, and no table links the two: whether an animal is in both is not known.
| Accuracy | Smoothness | Cost | ||||||||
|---|---|---|---|---|---|---|---|---|---|---|
| # | Method | Dice | Change | HD95 mm | SDlogJ | Folds % | Time s | RAM GB | GPU GB | Images |
| 1 | ConvexAdam (MIND)GPUapp | 0.693 ±0.010 | +0.092 | 1.03 ±0.12 | 0.155 | 5.13 | 6 | 2.2 | 1.1 | |
| No registration | 0.601 ±0.038 | 0.64 ±0.05 | 0.000 | 0.00 | ||||||
The order averages each method's ranks on Dice, HD95 mm, SDlogJ, so the first one is not always the best in every column. ± is the 95% interval of the mean over the 10 pairs. Two neighbours are tied when a paired Wilcoxon test on the shared pairs does not find the upper one better on Dice (5%): the places a method could hold are then shown under its own. The best value of each column is in colour. Click a row to see its images, a column title to sort by it. Time and memory measured on Laptop.
Dice: how much the organ contours overlap, 1 is perfect. HD95: distance between the contours' surfaces. SDlogJ: how irregular the deformation is, 0 is perfectly smooth. Folds: share of the image where the deformation folds over itself.
Pair by pair
Click a score to look at that result: the fixed image, and over it the moving image after registration, with the annotations. Underlined scores have their image; for the others you see the pair without the result. A green cell gained against no registration on that pair, a red one lost.
About the data
- Test pairs
- 28 animals have an in vivo and an ex vivo T2-weighted image, linked by the ex vivo file name, and a Label052 map on both; i134__ex022 is left out (see the notes). Of the 27, seed 2026 draws ten test animals, and the ten development animals are the last of the same seeded order. The seven others are not used.
- Truth
- contours by a program The provider's Label052 maps: 52 regions a hemisphere, merged from the Hashikawa histological atlas and brought onto each image by the provider with ANTs. They are automatic, drawn by nobody on these images. Names are the provider's legend, with hashikawa_ in front. Left and right are those of the in vivo header; the ex vivo maps number the hemispheres the other way round and are renumbered (see the notes).
- Source
- datasets.brainminds.jp/brainminds/MRI-NA216/src/commit/712ba782ab0dbd51c60f85a0bd43e6fa221c5f05
dataportal.brainminds.jp/marmoset-mri-na216
doi.org/10.24475/bminds.mri.thj.4624
doi.org/10.1038/s41597-023-02121-2 - Licence
- CC BY 4.0, source repository LICENSE
10 pairs for tuning, never tested
i164__ex032, i054__ex006, i118__ex016, i184__ex035, i161__ex030, i052__ex003, i105__ex012, i136__ex028, i183__ex036, i053__ex005