 fidopt
Paired 3T-7T brain MRI (UNC), 3T T1w to 7T T1w
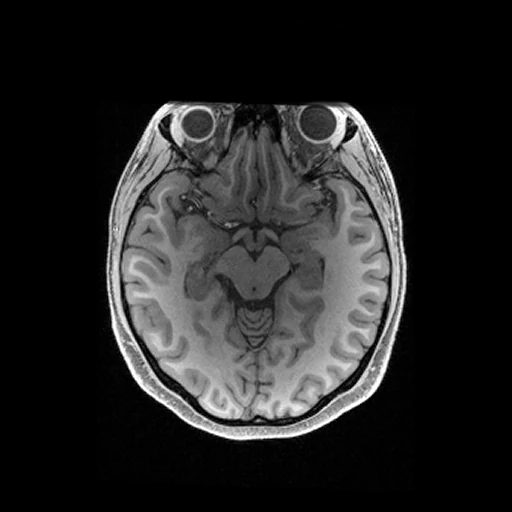
T1-weighted MR of one healthy adult's head at 3 T (source, MPRAGE) and 7 T (target, MP2RAGE), the 7T image brought onto the 3T grid by the provider's FSL FLIRT matrix (UNC paired 3T-7T dataset).
Read before comparing (10)
- Subjects. Ten healthy adults, 3 women and 7 men of 25 to 41 years, scanned at the University of North Carolina at Chapel Hill on a Siemens MAGNETOM Prisma at 3 T and a MAGNETOM Terra at 7 T, the 7T T1w 60 to 134 minutes after the 3T T1w.
- Source. The 3T MPRAGE as delivered, 0.8 mm voxels, defaced by PyDeface: the scanner's 12-bit magnitudes in arbitrary units. It is the image without prescan normalisation, so it keeps the receive coils' shading.
- Target. The 7T MP2RAGE's denoised uniform image ('mp2rage_UNI-DEN'), 0.65 mm, defaced the same way. It carries no coil shading, and the denoising darkens the background and where the signal is weak. On the 3T grid it keeps no detail finer than 0.8 mm.
- Alignment. The provider registered each 3T T1w to its 7T T1w with FSL FLIRT. prepare.py takes the same matrix the other way and reads the 7T T1w on the 3T grid, linearly, 0 past the 7T's field, so the source stays as delivered. The corpus registers nothing.
- Residual. The matrices shrink the 3T head by 5 to 8% in volume on every subject, which points to the two scanners' geometry; neither image is corrected for gradient non-linearity. An affine fit of the brain alone, not applied, would move it by 0.9 to 1.4 mm on average: at the 7T's sharp grey-white boundary, that millimetre counts as error for every method.
- Mask. The head inside both fields: the 3T T1w above a twentieth of its 99th percentile, its largest part, each slice's holes filled, where the 7T T1w holds data, inside its field and outside its defaced face; 3.2 to 4.2 litres. Below the cerebellum the 7T image grows dark over tissue the 3T image shows, error for every method too.
- Range. truth.dynamic_range is 4095, the 7T T1w's 12-bit scale as delivered. The targets reach 3824 to 4037, the voxels above 3000 almost all outside the brain.
- Baseline. Inside the mask on the ten test cases, a constant at the target's median over the whole image (the image fidopt check compares a method with) scores an MAE of 723 (595 to 862), a PSNR of 11.9 dB and an SSIM of 0.13; the source itself 471 (403 to 538), 15.6 dB and 0.39.
- Contrast. The source beats the constant because both images agree on what is dark and what is bright, not because their values match: white matter reads about three times the cortex at 7 T against 1.1 to 1.2 times at 3 T. Most of the source's error is the change of scale.
- Outside models. The record was published to train and evaluate 3T-to-7T synthesis: a network trained on it has seen these ten subjects. The paper reports no synthesis, so no outside number compares.
| Accuracy | Cost | ||||||||
|---|---|---|---|---|---|---|---|---|---|
| # | Method | MAE | Change | PSNR dB | SSIM | Time s | RAM GB | GPU GB | Images |
| 1 | SynthSRCPUapp | 465.9 ±29.9 | −5.1 | 15.52 ±0.74 | 0.380 ±0.007 | 10.5 | 0.6 | ||
| Source as given | 471.0 ±29.1 | 15.62 ±0.53 | 0.394 ±0.016 | ||||||
The order averages each method's ranks on MAE, PSNR dB, SSIM, so the first one is not always the best in every column. ± is the 95% interval of the mean over the 10 cases. Two neighbours are tied when a paired Wilcoxon test on the shared cases does not find the upper one better on MAE (5%): the places a method could hold are then shown under its own. The best value of each column is in colour. Click a row to see its images, a column title to sort by it. Time and memory measured on Laptop.
MAE: mean absolute error of a synthetic image against its target, inside the body, in the image's units. PSNR: the same by signal-to-noise ratio, higher is better. SSIM: the same by structural similarity, 1 is perfect.
Case by case
Click a score to look at that result: the target image, and over it the method's synthetic image. Underlined scores have their image; for the others you see the case without the result.
About the data
- Test cases
- All ten subjects are test cases: the record holds ten, so none is left for development.
- Truth
- target image as released the subject's 7T T1w (MP2RAGE, the scanner's denoised uniform image, on its 0 to 4095 scale as delivered), brought onto the 3T T1w's grid through the provider's FSL FLIRT affine matrix, by linear interpolation
- Source
- doi.org/10.6084/m9.figshare.c.6485272.v1
doi.org/10.6084/m9.figshare.23706033.v2
doi.org/10.1038/s41597-023-02400-y - Licence
- CC0 1.0