 fidopt
BioSR wide-field to linear SIM, endoplasmic reticulum, 2D
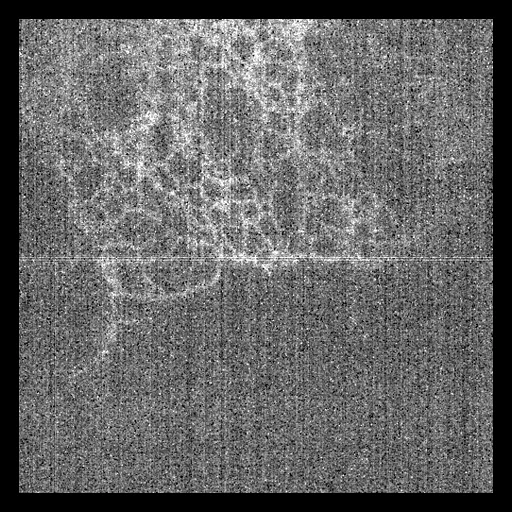
One cell's endoplasmic reticulum in 2D: the wide-field image at the lowest signal level, the mean of nine raw SIM images, with the linear SIM image of the same field as target (BioSR).
15 test casescellsource wide-field, target SIM2D, distances in µm
Read before comparing (9)
- Case. The source is the mean of the cell's nine raw SIM images (three angles, three phases) at signal level 1, the provider's own wide-field image, in camera counts with an offset of about 100. The target is the provider's SIM image of the same frame: 1004 x 1004 pixels of 31.3 nm, written in micrometres as if millimetres.
- Alignment. The source is put on the target's grid by linear interpolation, its pixel k on SIM pixel 2k. The shift left is at most 0.60 SIM pixel (er_037, the noisiest cell), 0.31 on the next; prepare.py refuses a case over one pixel.
- Values. The target is uint16, scaled by the provider so that one pixel is 65535, and is divided by its largest value (truth.dynamic_range 1). Nothing in the source predicts that per-image scale, hence the per-case normalisation.
- Mask. The cell's labelled structure: the SIM image smoothed by a Gaussian of 0.3 µm, above Otsu's threshold, grown by 1 µm; 16 to 81 % of the field. Made from the target and given to every method.
- Baseline. Inside the mask at a range of 1 on the 15 test cases, a constant at the target's median scores an MAE of 0.081 (0.044 to 0.104), a PSNR of 18.1 dB (16.2 to 23.0) and an SSIM of 0.49 (0.37 to 0.64). That SSIM is of the order other ranked synthesis sets give a constant, so SSIM is ranked here.
- Noisy cells. Test cells er_037 and er_046 have a level-1 image that is nearly all noise (band-passed correlation with the SIM image 0.12 and 0.15), the network of tubules barely seen. They are kept, the provider's test cells at this level with sound targets; they weigh on the means, so read them per case.
- Structures. BioSR's four structures are four datasets, BioSR_CCP_Syn, BioSR_ER_Syn, BioSR_MT_Syn and BioSR_Actin_Syn, because its pretrained models are trained one a structure. Each cell lies in one zip of the deposit, so no cell is in two.
- Overlap. No other dataset of the corpus holds BioSR images. BioTISR_Syn is the same laboratory's 3D-SIM time-lapse deposit of live COS-7 cells: other cells and acquisitions, no file shared.
- Outside models. All of BioSR is public with its targets: a model trained on all of it has seen the test cases.
No method has a result on every case of this dataset yet.
| Accuracy | Cost | ||||||||
|---|---|---|---|---|---|---|---|---|---|
| # | Method | MAE | Change | PSNR µm | SSIM | Time s | RAM GB | GPU GB | Images |
| Source as given | 102.2 ±2.2 | -40.18 ±0.19 | 0.000 ±0.000 | ||||||
MAE: mean absolute error of a synthetic image against its target, inside the body, in the image's units. PSNR: the same by signal-to-noise ratio, higher is better. SSIM: the same by structural similarity, 1 is perfect.
Case by case
Click a score to look at that result: the target image, and over it the method's synthetic image. Underlined scores have their image; for the others you see the case without the result.
About the data
The first test caseClick to look at every case.
- Test cases
- The provider's 15 test cells for the endoplasmic reticulum, whole (Cell_036 to Cell_050, the default test list of its DL-SR code), and 10 development cells drawn with seed 2026 among its training and validation cells (Cell_001 to Cell_035). One cell a case, at signal level 1.
- Truth
- target image as released the provider's linear SIM image of the cell at its signal level (GTSIM_level_01.mrc; ER's cells are time series with a SIM image a level), reconstructed from high-signal raw SIM images, divided by its largest value
- Source
- figshare.com/articles/dataset/BioSR/13264793
doi.org/10.6084/m9.figshare.13264793.v9
doi.org/10.1038/s41592-020-01048-5
github.com/qc17-THU/DL-SR - Licence
- CC BY 4.0 (the figshare record's licence field)
10 cases for tuning, never tested
er_024, er_006, er_027, er_032, er_033, er_010, er_012, er_009, er_008, er_028