 fidopt
BioSR wide-field to linear SIM, F-actin, 2D
One F-actin cell of BioSR, in 2D: the wide-field image at the lowest signal level, the mean of nine raw SIM images, as source, and the linear SIM image of the same field as target.
Read before comparing (10)
- Case. The source is the mean of the cell's nine raw SIM images at signal level 1, the noisiest level, kept in camera counts with an offset of about 100. The target is the provider's linear SIM reconstruction from the cell's high-signal raw images, 1004 x 1004 pixels of 31.3 nm. The source is a low-signal image to denoise and sharpen.
- Alignment. prepare.py puts the source on the target's grid by linear interpolation, its pixel k on SIM pixel 2k, and refuses a case off by more than one pixel. The shift left is at most 0.39 SIM pixel on the first ten test cells and the development cells, 0.29 on the five other test cells.
- Target. The provider scales each SIM image so that one pixel is 65535; divided by its largest value it lies between 0 and 1, and truth.dynamic_range is 1. Nothing in the source predicts this per-image scale.
- Mask. The cell's structure: the SIM image smoothed by a Gaussian of 0.3 µm, above Otsu's threshold, grown by 1 µm. It is made from the target and given to every method.
- Baseline. Inside the mask on the 15 test cases, a constant at the target's median scores an MAE of 0.055 (0.045 to 0.080), a PSNR of 21.7 dB (19.4 to 23.6) and an SSIM of 0.54 (0.40 to 0.60). On the first ten, the source mapped linearly onto the target by least squares, which needs the target, scores 0.033 (0.024 to 0.070) and 27.3 dB.
- Ranking. A method must beat that linear map to do better than rescaling its input. SSIM is ranked: the constant's, about 0.5, is of the order other ranked synthesis sets give a constant, 0.47 to 0.62.
- Noisy cells. Test cells actin_037 and actin_048 have a level-1 image that is nearly all noise, camera counts 89 to 117 around the offset, correlating with the SIM image at 0.19 and 0.17 against 0.79 for actin_040. They are kept, drawn by the seed and not chosen by eye; on them the linear rescaling scores about as the constant. Read them per case.
- Overlap. BioSR's four structures are four datasets, BioSR_CCP_Syn, BioSR_ER_Syn, BioSR_MT_Syn and this one, since BioSR's pretrained models are trained one a structure; each cell lies in one zip of the deposit, so no cell is in two. No other dataset holds BioSR images: BioTISR_Syn, from the same laboratory, is another deposit of other cells and acquisitions.
- Outside numbers. The test cells are the provider's own, its code training on cells 6 to 35 and validating on 1 to 5, but all of BioSR is public with its targets: a model trained on all of it has seen the test cases.
- Units. Pixels of 31.3 nm are written in micrometres where the image headers expect millimetres, as in the corpus's other microscopy sets.
| Accuracy | Cost | ||||||||
|---|---|---|---|---|---|---|---|---|---|
| # | Method | MAE | Change | PSNR µm | SSIM | Time s | RAM GB | GPU GB | Images |
| 1 | DFCAN · F-actinCPUapp | 0.0 ±0.0 | −110.4 | 26.36 ±1.43 | 0.639 ±0.065 | 13 | 1.9 | ||
| Source as given | 110.4 ±2.8 | -40.87 ±0.23 | 0.000 ±0.000 | ||||||
The order averages each method's ranks on MAE, PSNR µm, SSIM, so the first one is not always the best in every column. ± is the 95% interval of the mean over the 15 cases. Two neighbours are tied when a paired Wilcoxon test on the shared cases does not find the upper one better on MAE (5%): the places a method could hold are then shown under its own. The best value of each column is in colour. Click a row to see its images, a column title to sort by it. Time and memory measured on Laptop.
MAE: mean absolute error of a synthetic image against its target, inside the body, in the image's units. PSNR: the same by signal-to-noise ratio, higher is better. SSIM: the same by structural similarity, 1 is perfect.
Case by case
Click a score to look at that result: the target image, and over it the method's synthetic image. Underlined scores have their image; for the others you see the case without the result.
About the data
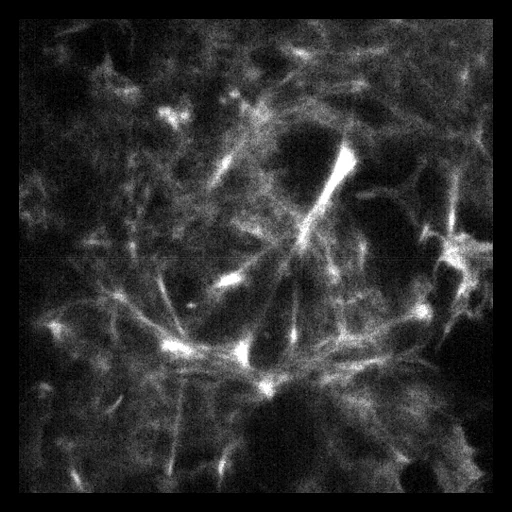
- Test cases
- The provider's 15 F-actin test cells, Cell_036 to Cell_050, taken whole as the test cases, and 10 development cells drawn among its training and validation cells, Cell_001 to Cell_035. One cell is one case, at signal level 1.
- Truth
- target image as released the provider's linear SIM image of the cell (SIM_gt.mrc), reconstructed from the cell's high-signal raw SIM images, divided by its largest value
- Source
- figshare.com/articles/dataset/BioSR/13264793
doi.org/10.6084/m9.figshare.13264793.v9
doi.org/10.1038/s41592-020-01048-5
github.com/qc17-THU/DL-SR - Licence
- CC BY 4.0 (the figshare record's licence field)
10 cases for tuning, never tested
actin_005, actin_011, actin_032, actin_021, actin_027, actin_003, actin_014, actin_006, actin_016, actin_030