 fidopt
SAROS body regions
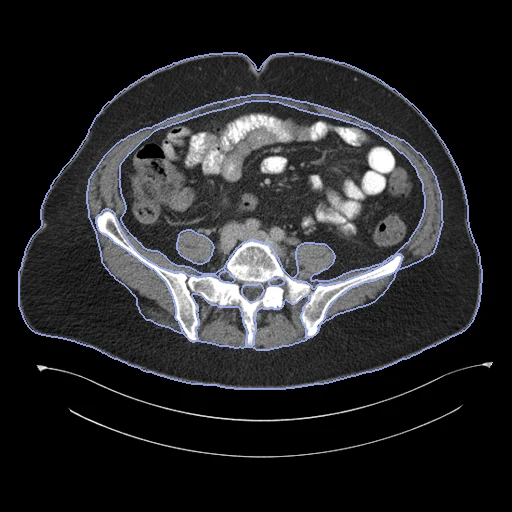
CT of the abdomen, chest or whole body from an open TCIA collection, resampled to 5 mm slices, with 13 body regions corrected by people on every fifth slice (SAROS, University Hospital Essen).
Read before comparing (9)
- Source. SAROS, a TCIA analysis result, gives label maps for 900 CT series of 882 patients from 28 TCIA collections. prepare.py reads each series from TCIA and resamples it as the provider's script does, along the body to 5 mm slices, linearly, pixel size kept: the labels exist on no other grid. Values are Hounsfield units, the scanners' padding kept.
- Truth. A network trained on the provider's in-house data proposed the regions; a reader corrected every fifth slice, with the first and last, in ITK-SNAP, and a quality control team reviewed the maps by hand and by automatic checks. Version 2 corrected 91 cases where bones were labelled muscle. Graded semi-automatic; the TCIA page names medical residents and students as the readers.
- Ignore. The unreviewed slices, 78 to 79% of the voxels on the 20 cases built first, are an ignore region never shown to methods: a method segments the whole volume and is scored on the reviewed slices.
- Surface. Surface measures are flattered: each reviewed slice is a slab whose flat faces lie at distance 0 where two maps overlap. On TotalSegmentator's maps of two test cases the surface Dice at 3 mm, the provider's tolerance, reads 0.98 for the pericardium in 3D and 0.82 to 0.86 slice by slice. HD95 says little, the reviewed slices being 25 mm apart.
- Labels. The provider's definitions: subcutaneous tissue includes the skin; muscle includes fascia and the fat between muscles; the cavities, pericardium and mediastinum are regions, the pericardium holding the heart and the fat in its sac; bone is every bone; glands hold both sides. Organs are not labelled. The regions cover the body on a reviewed slice.
- Cases. Every test CT holds the subcutaneous tissue, muscle, both cavities, bone, mediastinum and spinal cord; the pericardium is on 82 of the 84, the thyroid on 43, the brain and parotid glands on 14, the submandibular glands on 12 and a breast implant on one.
- Exclusions. Left out by licence: NSCLC-Radiomics and NSCLC-Radiomics-Genomics (CC BY-NC 3.0) and the six controlled-access head and neck collections. Left out because another dataset draws on them without naming patients: Anti-PD-1_Lung, TCGA-LUAD, TCGA-LUSC and NSCLC Radiogenomics. Left out by patient: those of KiTSCT, AorticTreeCTA, PancreasCT8, SarcomaLimbMR, L2R_AbdomenMRCT, LIDCNodules, CPTACPDALesions, CPTACUCECLesions and ACRIN6668_CTPET_Syn.
- Overlap. The provider's table, Segmentation-Info_09-29-2023.csv, names each case's TCIA patient. KiTSCT leaves these patients out; ACRIN6668_CTPET_Syn and the CPTAC lesion sets hold some of these collections' patients in their pools and must too. Unresolved: TotalSegMR and LiverSegmentsMR hold Imaging Data Commons MR series of unknown patients from matching collections, TCGA-LIHC, CPTAC-PDA and ACRIN-NSCLC-FDG-PET among them.
- Room. The provider's 2D nnU-Net, in cross-validation, scores a Dice of 0.97 to 0.99 on most regions, 0.96 on the spinal cord and 0.91 on the mediastinum; the room is in the small glands (thyroid 0.83, parotid 0.76, submandibular 0.56) and the breast implant (0.59). A network trained on the five folds has not seen the test cases, though their maps are public.
| Accuracy | Cost | |||||||
|---|---|---|---|---|---|---|---|---|
| # | Method | Dice | Surface Dice | HD95 mm | Time s | RAM GB | GPU GB | Images |
| 1 | KonfAI segmentation app · IMPACTSeg body, KonfAI appGPUapp9 of 13 structures | 0.896 ±0.004 | 0.962 ±0.003 | 6.16 ±1.24 | 25 | 1.9 | 3.2 | |
| 2 | KonfAI segmentation app · TotalSegmentator (total), the authors' packageGPUapp4 of 13 structures | 0.820 ±0.008 | 0.929 ±0.008 | 16.50 ±1.68 | 96 | 21.3 | 5.0 | |
| 3 | KonfAI segmentation app · TotalSegmentator (total), KonfAI appGPUapp4 of 13 structures | 0.815 ±0.009 | 0.929 ±0.008 | 16.43 ±1.71 | 36 | 4.1 | 5.8 | |
| 4 | KonfAI segmentation app · TotalSegmentator (head_glands_cavities), the authors' packageGPUapp2 of 13 structures | 0.640 ±0.091 | 0.774 ±0.099 | 15.24 ±4.58 | 41 | 10.5 | 1.5 | |
| 5 | MONAI wholeBody CTGPUapp2 of 13 structures41 failed | 0.369 ±0.079 | 0.446 ±0.095 | 38.53 ±3.65 | 29 | 4.0 | 7.6 | |
| 6 | KonfAI segmentation app · MRSegmentator, KonfAI appGPUapp1 of 13 structures | 0.271 ±0.056 | 0.284 ±0.059 | 289.03 ±27.31 | 33 | 3.4 | 7.1 | |
The order averages each method's ranks on Dice, Surface Dice, HD95 mm, so the first one is not always the best in every column. ± is the 95% interval of the mean over the 84 cases. Two neighbours are tied when a paired Wilcoxon test on the shared cases does not find the upper one better on Dice (5%): the places a method could hold are then shown under its own. The best value of each column is in colour. Click a row to see its images, a column title to sort by it. Time and memory measured on Workstation.
Dice: how much the organ contours overlap, 1 is perfect. Surface Dice: the share of the contours' surfaces within a tolerance of each other, 1 is perfect. HD95: distance between the contours' surfaces.
Case by case
Click a score to look at that result: the image, the truth in green and the method's map in red. Underlined scores have their image; for the others you see the case without the result.
About the data
- Test cases
- The 84 CTs of the provider's test split under CC BY 3.0 or 4.0, of no patient the corpus holds and with a label map on their image's grid, one a patient: 40 abdomen, 30 thorax and 14 whole body. 30 development CTs from its five training folds, the last of the same seeded order among 427.
- Truth
- contours by a program, verified by people the provider's body-regions map: a network's proposal on the CT resampled to 5 mm slices, reviewed and corrected by a reader in ITK-SNAP on every fifth slice, with the first and the last, then checked by a quality control team; the other slices carry no truth and are the ignore region
- Source
- www.cancerimagingarchive.net/analysis-result/saros
doi.org/10.25737/SZ96-ZG60
doi.org/10.1038/s41597-024-03337-6
github.com/UMEssen/saros-dataset
www.cancerimagingarchive.net/wp-content/uploads/Segmentation-Info_09-29-2023.csv - Licence
- CC BY 4.0 (label maps), CC BY 3.0 or CC BY 4.0 (the images: 108 and 6 of the 114 built)
30 cases for tuning, never tested
case_029, case_132, case_282, case_188, case_545, case_116, case_212, case_745, case_100, case_356, case_312, case_749, case_044, case_310, case_226, case_758, case_079, case_396, case_066, case_297, case_238, case_422, case_586, case_026, case_324, case_431, case_317, case_511, case_049, case_186