 fidopt
Simulated CBCT to planning CT, LCTSC
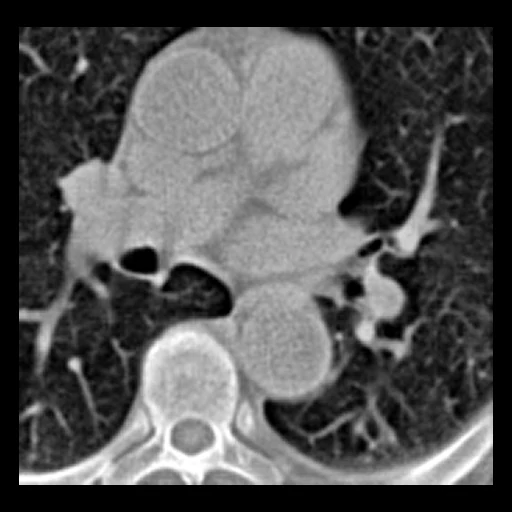
Simulated CBCT (normalised, no unit) as source and the planning CT it was simulated from, in Hounsfield units, as target on the same cropped grid.
Read before comparing (6)
- Images. The deposit's base pair without its geometric augmentations: the CBCT (OS-SART reconstruction) is simulated from the planning CT on the same cropped grid; no real cone-beam acquisition is involved. The CBCT stays on the provider's normalised scale, which differs by patient, without Hounsfield units.
- Target. The provider scales each planning CT to 0–1; preparation restores Hounsfield units by fitting the scale to the patient's original TCIA CT. Over the 16 patients the median case mean absolute residual is 0.218 HU (at most 1.924 HU), and at most 0.505% of voxels differ by over 20 HU, mostly near crop edges.
- Alignment. No deformation is added: the pair is aligned by construction.
- Mask. The body inside the CBCT's field of view, the CT above -970 HU, lungs included, not the air around the patient nor that of the trachea and large bronchi: an evaluation mask, not an anatomical truth. Voxels outside the simulated cone lie outside it.
- Baseline. Inside the mask on the 10 test patients a constant at each target's median scores a median MAE of 300.5 HU, PSNR of 19.41 dB and SSIM of 0.111. The source is normalised per patient, so a method must recover the CT scale rather than copy its input.
- Overlap. These patients are LCTSC Train patients outside LCTSC's development pairs and outside PsCBCTThorax. A method trained on LCTSC's Train set has seen them and must leave them out. PsCBCTThorax_Seg and PsCBCTThorax_Syn share these patients and this partition; neither shows the other's truth.
No method has a result on every case of this dataset yet.
Under a licence that is not open
Methods whose code or weights are released for non-commercial use, or under share-alike or custom terms: shown for reference, ranked nowhere.
| Accuracy | Cost | ||||||||
|---|---|---|---|---|---|---|---|---|---|
| # | Method | MAE | PSNR dB | SSIM | Time s | RAM GB | GPU GB | Machine | Images |
| KonfAI synthesis app · TotalSynth CBCT to CT, KonfAI appGPUapptrained on CC-BY-NC-4.0 dataolder run | 802.0 ±26.4 | 13.24 ±0.19 | 0.176 ±0.024 | 19 | 3.7 | 4.4 | Workstation | ||
| nnsyn · CBCT to CT, thoraxGPUapptrained on CC-BY-NC-4.0 dataolder run | 353.3 ±18.5 | 18.86 ±0.35 | 0.080 ±0.027 | 22 | 3.7 | 2.3 | Laptop | ||
MAE: mean absolute error of a synthetic image against its target, inside the body, in the image's units. PSNR: the same by signal-to-noise ratio, higher is better. SSIM: the same by structural similarity, 1 is perfect.
Case by case
| MAE | 1 | 2 | 3 | 4 | 5 | 6 | 7 | 8 | 9 | 10 |
|---|
Click a score to look at that result: the target image, and over it the method's synthetic image. Underlined scores have their image; for the others you see the case without the result.
About the data
- Test cases
- 10 test and 6 development patients, the 16 LCTSC Train patients no other dataset holds: LCTSC uses the 24 provider Test patients and 20 Train patients, PsCBCTThorax the 24 Test patients and 10 of those 20. The test patients were drawn with seed 2026 by site in proportion (2, 4 and 4 from S1, S2 and S3); the other six are the development patients.
- Truth
- target image as released The planning CT the provider simulated the CBCT from, on the same grid, in Hounsfield units recovered from LCTSC's original CT; aligned by construction.
- Source
- zenodo.org/records/5035494
doi.org/10.5281/zenodo.5035494
doi.org/10.1088/1361-6560/abe2eb
www.cancerimagingarchive.net/collection/lctsc
doi.org/10.7937/K9/TCIA.2017.3R3FVZ08 - Licence
- CC BY 4.0 (the Zenodo record); the planning CTs and contours it is made of are LCTSC's, CC BY 3.0
6 cases for tuning, never tested
Train-S1-004, Train-S1-012, Train-S2-006, Train-S2-007, Train-S3-001, Train-S3-012