 fidopt
AVT aortic vessel tree
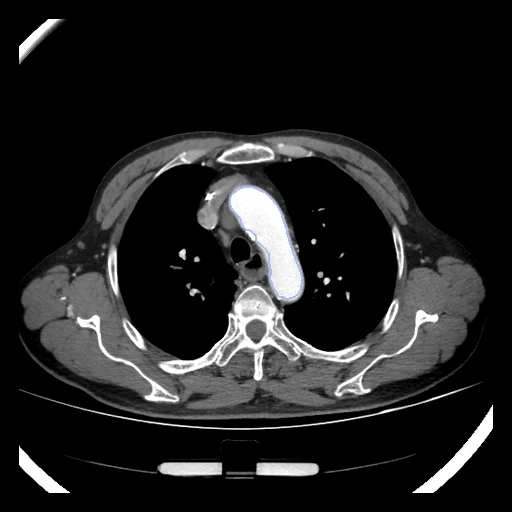
CT, usually an angiography, from the neck to the groin of one patient, the aorta and its branches labelled as one structure (AVT aortic vessel tree, the training set of the SEG.A. 2023 challenge).
Read before comparing (8)
- Sources. 56 CTs, one patient each, chosen by the authors for image quality and a whole aortic tree: 20 arterial-phase KiTS19 training CTs with healthy aortas; 18 RIDER Lung PET-CT CTs of lung cancer patients, five with an aortic dissection (R1, R2, R5, R7, R8) and one with an abdominal aortic aneurysm (R6); 18 CT angiographies of the Affiliated Dongyang Hospital of Wenzhou Medical University.
- Contrast. Four RIDER CTs (R14, R15, R16, R18) are the CT of a PET/CT, with no contrast agent recorded. On R18, a development case, the blood inside the label reads 37 HU (median), against 117 to 439 HU on the 19 other CTs built; the KiTS CTs show the least contrast (117 to 178 HU, K1 397).
- Truth. One label a CT, drawn once by one annotator: no second reading tells how far two people would differ. On a dissection the true and false lumens were drawn apart and joined, the flap kept out by a shell of 2.5 mm.
- Branches. Every CT has the ascending aorta, the arch and its three branches, the thoracic and abdominal aorta and the iliac arteries; smaller branches (the celiac trunk, the superior mesenteric artery, on some the renal arteries) run only as far as the annotator followed them. A method that follows a branch further or less far than the label loses there, however well it draws the aorta.
- TotalSegmentator. The structure is the whole tree, not TotalSegmentator's aorta. On test case R12, version 2.18.0's aorta alone covers 74% of the tree (Dice 0.78, HD95 171 mm); with its brachiocephalic trunk, subclavian, common carotid and iliac arteries 93% (Dice 0.86, HD95 26 mm), its neck and shoulder arteries lying only 30 to 51% inside the label.
- Values. The KiTS and RIDER files hold the Hounsfield units plus 1024, K18 excepted; prepare.py takes the 1024 off, its one change. The RIDER CTs keep TCIA's padding of -3024 HU around the reconstructed circle. Test cases K1 and R1 hold 1059 and 1064 slices of 512 by 512 voxels, close to 280 million voxels.
- Overlap. The paper names RIDER Lung CT as the RIDER source, but each RIDER CT matches a series of RIDER Lung PET-CT by slice count, pixel spacing and origin, and a slice of each of the six built equals its DICOM voxel for voxel. No other dataset of the corpus holds these CTs: none is built from KiTS19 or RIDER Lung PET-CT, and RIDERLungCT holds other patients.
- Outside numbers. None: SEG.A. 2023 trained on these 56 CTs and ranked its entries on five hidden CTs of a fourth centre.
| Accuracy | Cost | ||||||||
|---|---|---|---|---|---|---|---|---|---|
| # | Method | Dice | Surface Dice | HD95 mm | Time s | RAM GB | GPU GB | Machine | Images |
| 1 | KonfAI segmentation app · TotalSegmentator (total), the authors' packageGPUapp | 0.851 ±0.014 | 0.590 ±0.105 | 17.53 ±11.94 | 33.5 | 7.0 | Laptop | ||
| 22–3 | KonfAI segmentation app · TotalSegmentator (total), KonfAI appGPUapp | 0.849 ±0.015 | 0.579 ±0.111 | 17.06 ±12.05 | 2.8 | 10.4 | Laptop | ||
| 32–3 | KonfAI segmentation app · MRSegmentator, KonfAI appGPUapp | 0.850 ±0.011 | 0.577 ±0.105 | 34.88 ±13.35 | 2.8 | 14.2 | Laptop | ||
| 3 | MONAI wholeBody CTGPUapp9 failed | 0.085 ±0.192 | 0.044 ±0.101 | 6.00 | 19 | 4.3 | 8.7 | Workstation | |
The order averages each method's ranks on Dice, Surface Dice, HD95 mm, so the first one is not always the best in every column. ± is the 95% interval of the mean over the 10 cases. Two neighbours are tied when a paired Wilcoxon test on the shared cases does not find the upper one better on Dice (5%): the places a method could hold are then shown under its own. The best value of each column is in colour. Click a row to see its images, a column title to sort by it.
1 result not ranked: an older run, cases still missing, or a failure on every case
| Accuracy | Cost | ||||||||
|---|---|---|---|---|---|---|---|---|---|
| # | Method | Dice | Surface Dice | HD95 mm | Time s | RAM GB | GPU GB | Machine | Images |
| MONAI wholeBody CTGPUapp2 failedolder run | 0.671 ±0.253 | 0.461 ±0.188 | 34.67 ±14.69 | 19 | 3.2 | 16.5 | Laptop | ||
Dice: how much the organ contours overlap, 1 is perfect. Surface Dice: the share of the contours' surfaces within a tolerance of each other, 1 is perfect. HD95: distance between the contours' surfaces.
Case by case
Click a score to look at that result: the image, the truth in green and the method's map in red. Underlined scores have their image; for the others you see the case without the result.
About the data
- Test cases
- 10 test CTs drawn with seed 2026 among the 46 outside development, the three sources in proportion: four KiTS, three RIDER and three Dongyang. 10 development CTs.
- Truth
- contours by a program, verified by people one label, the aorta from its root to the iliac arteries with its branches: the brachiocephalic trunk, the left common carotid and the left subclavian arteries on every CT, smaller branches (the celiac trunk, the superior mesenteric artery) where the slices show them; drawn in 3D Slicer by one annotator, a biomedical student, from a local threshold grown by GrowCut and corrected by hand (a few CTs drawn by hand), then checked by a senior radiologist (the challenge's proposal)
- Source
- doi.org/10.6084/m9.figshare.14806362.v1
doi.org/10.1016/j.dib.2022.107801
doi.org/10.5281/zenodo.7861733
arxiv.org/abs/2510.24009
multicenteraorta.grand-challenge.org
doi.org/10.7937/TCIA.2019.IX49E8NX
doi.org/10.7937/K9/TCIA.2015.OFIP7TVM
github.com/neheller/kits19/blob/master/data/LICENSE - Licence
- CC BY 4.0 (the figshare record)
10 cases for tuning, never tested
K13, K14, R13, D15, K8, R18, D18, K12, R5, D16